Modern City Theme Income Statement Table – Visual Financial Analysis
RJ0300094_18
- Last Update 05/15/2025
- File Size 1.1MB
- # of Slides 2
- File Format PPTX
- Slide Ratio 16:9
- Color
Keywords
- #Content-Based Slides
- #Design-Based Slides
- #Financial Plans and Performance
- #Diagram
- #Income Statement
- #Key Financial Indicators
- #Table
- #Standard Table
- #16:9
- #income statement table PowerPoint
- #financial table slide
- #profit and loss statement template
- #financial data presentation
- #accounting table PPT
- #financial analysis slide design
About the Product
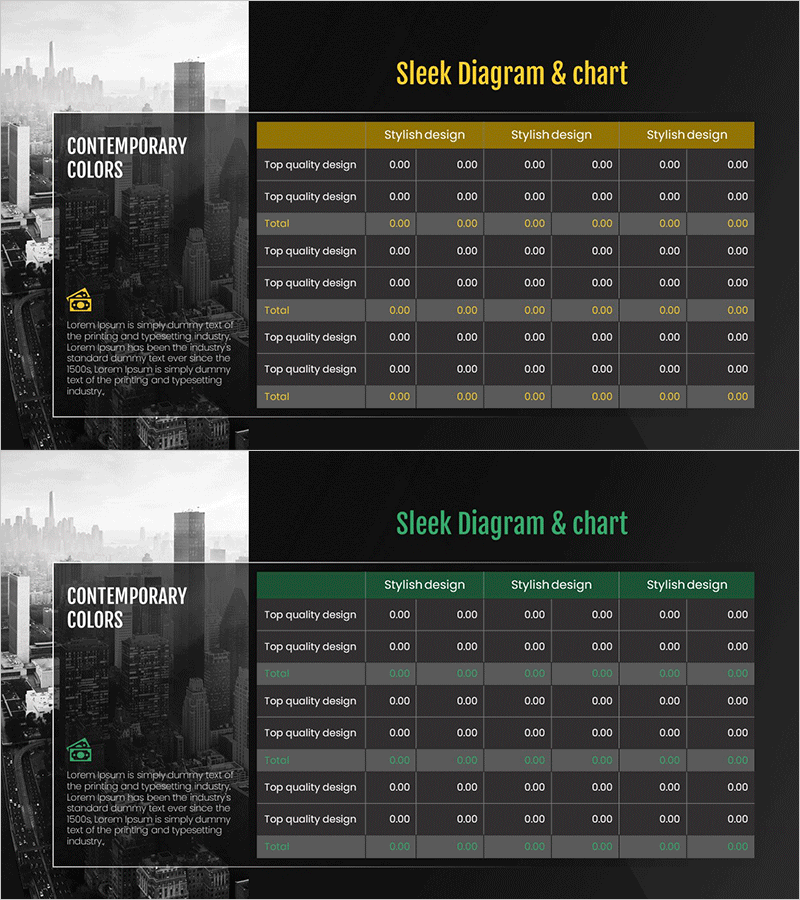
A modern city-themed income statement table PowerPoint slide featuring a professional dark background with cityscape imagery. The 6-column horizontal table structure enables clear comparison and analysis of financial figures across periods, departments, or scenarios. Gold accent colors highlight key rows against the dark background, improving data visibility and emphasis. The 2-slide set accommodates multiple financial analysis presentations with editable PPTX format for immediate customization.
Usage Points
-
Main Usage
Present income statement data visually in financial reports, business plans, and investor presentations. The table layout organizes revenue, expenses, and profit items in rows while periods, departments, or scenarios occupy columns, enabling multi-dimensional financial comparison at a glance.
-
How to Use
Enter actual financial figures directly into table cells for immediate use. Add or remove rows to adjust line items, and resize columns to fit data volume. Apply gold accent formatting to total rows to emphasize key financial metrics and draw audience attention to critical figures.
-
Recommended For
CFOs, finance managers, and accounting teams presenting financial performance to executives, investors, and boards. Ideal for quarterly and annual earnings comparisons, departmental profitability analysis, and scenario-based financial forecasting. Recommended for financial services, consulting, and manufacturing companies requiring formal financial presentations.
-
Slide Structure
2-slide set with two 6-column × 7-row tables. Each table includes header row (column titles), data rows (line items with figures), and total row (sums and percentages). Dark background with white text and gold accent rows create visual hierarchy. 16:9 widescreen format optimized for large-screen presentations.
Related Products
-

Income Statement Table – Clearly Presenting Financial Performance
#Financial Plans and Performance #Diagram #Income Statement
-

Premium Management Presentation Table – Efficient Financial Planning
#Financial Plans and Performance #Diagram #Income Statement
-

Key Financial Indicators Table – Essential Information Visualization
#Financial Plans and Performance #Diagram #Income Statement
-

Income Statement Table – Clearly Presenting Financial Plans and Performance
#Financial Plans and Performance #Diagram #Income Statement
