Segmentation Analysis Graph – Business Strategy and Future Outlook
RJ0300092_18
- Last Update 05/15/2025
- File Size 1.1MB
- # of Slides 2
- File Format PPTX
- Slide Ratio 16:9
- Color
Keywords
- #Content-Based Slides
- #Design-Based Slides
- #Business Vision and Strategy
- #Market and Competitor Analysis
- #Graph
- #Business Strategy
- #Future Outlook
- #Column
- #Segmented Column
- #16:9
- #vertical bar chart PowerPoint
- #segmentation analysis slide
- #market analysis presentation
- #business strategy graph
- #data visualization PowerPoint
- #chart template download
About the Product
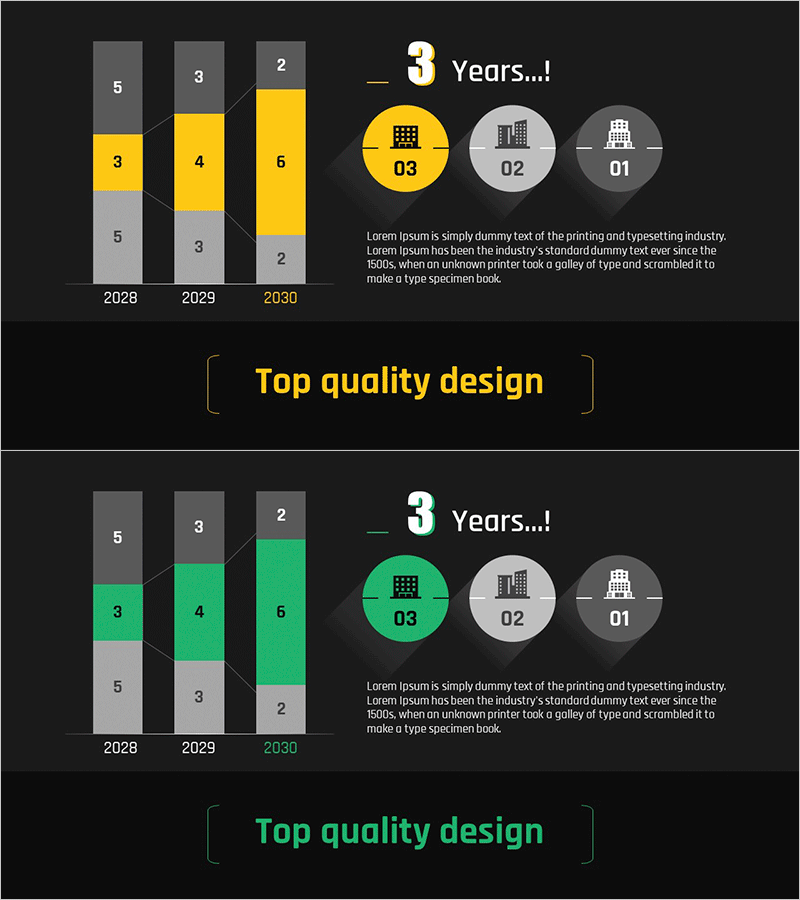
A professional PowerPoint slide designed to visualize segmentation analysis data essential for business strategy development. This presentation template displays a three-year market segmentation trend from 2028 to 2030 across three categories using vertical bar charts. The design employs contrasting yellow and gray color schemes to clearly distinguish annual data, with circular icon areas for supplementary information display. The slide is ready to use for market analysis presentations, business planning sessions, strategic reviews, and investor pitches.
Usage Points
-
Main Usage
This slide enables side-by-side comparison of market segmentation data across three years, facilitating quick analysis and insight extraction. The vertical bar graph effectively represents numerical changes across three categories, delivering key strategic insights during business planning presentations. The circular icon areas allow for supplementary explanations and detailed information.
-
How to Use
Edit the vertical bar values with your actual data to customize the slide. Input your category data by year, and the chart updates automatically. Add key achievements or strategic points to the circular icon areas on the right side to enhance storytelling and narrative flow in your presentation.
-
Recommended For
Marketing managers, business planners, executive report coordinators, and consultants presenting market analysis findings. Ideal for quarterly performance reports, annual business plan presentations, investor briefings, and strategic planning meetings where data-driven decision-making is essential.
-
Slide Structure
Two-slide layout featuring vertical bar charts with contrasting color schemes—yellow accent on slide one, green accent on slide two. Each slide displays 3 years (2028, 2029, 2030) × 3 categories of data, with three circular icon areas and descriptive text boxes positioned on the right side for additional context.
Related Products
-

Cartoon Theme Vertical Bar Segmentation Graph – Vision and Growth
#Market and Competitor Analysis #Graph #Future Outlook
-

Visualizing Hawaii Travel Demand Forecast with Graphs
#Market and Competitor Analysis #Graph #Future Outlook
-

Camping Business Trend Graph – Future and Vision
#Market and Competitor Analysis #Graph #Customer Analysis
-

Change Graph by Business Item – Market Trend Analysis
#Business Strategy #Market and Competitor Analysis #Graph
