Arctic Business Market Analysis Chart by Year – Visualizing Business Goals
RJ0600040_5
- Last Update 07/01/2025
- File Size 0.5MB
- # of Slides 2
- File Format PPTX
- Slide Ratio 16:9
- Color
Keywords
- #Content-Based Slides
- #Design-Based Slides
- #Business Vision and Strategy
- #Market and Competitor Analysis
- #Diagram
- #Graph
- #Business Goals
- #Future Outlook
- #Flow
- #Column
- #Linear Flow
- #Segmented Column
- #16:9
- #100% stacked column chart PowerPoint
- #year-over-year data visualization
- #cumulative percentage chart slide
- #market analysis PowerPoint template
- #stacked bar graph presentation
About the Product
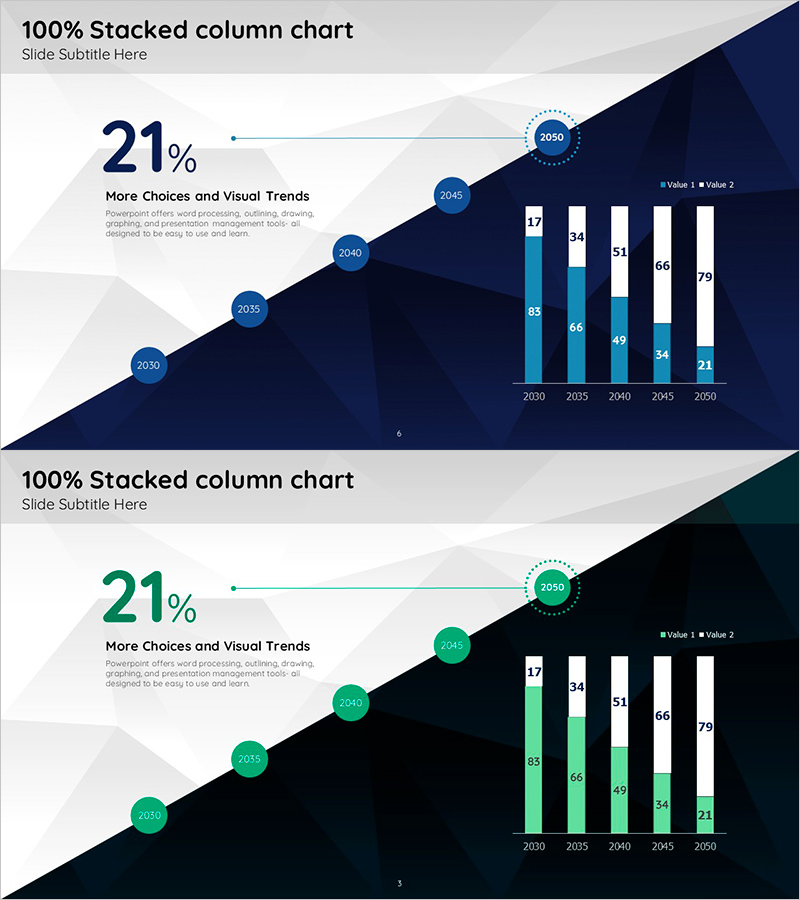
A 100% stacked column chart PowerPoint slide designed to visualize year-over-year market data from 2030 to 2050. This presentation template features a dual-color scheme with navy blue and light blue bars, representing two data series across five years in cumulative percentage format. The left side displays a timeline with circular nodes marking each year, while the right side shows the stacked column chart with precise numerical values. The diagonal background design connects the timeline to the chart, emphasizing temporal progression and data trends. Perfect for business reports, market analysis presentations, and strategic planning decks where comparative data visualization is essential.
Usage Points
-
Main Usage
Visualize the composition ratio changes across multiple years using a 100% stacked format, allowing viewers to understand both individual series contribution and overall trend simultaneously. Ideal for displaying market share evolution, revenue composition changes, and business performance metrics over time.
-
How to Use
Replace the numerical values with your own data while maintaining the two-series structure. Customize colors to match your corporate branding and adjust the timeline years as needed. The slide is fully editable in PowerPoint, allowing you to modify text, colors, and data values for business reports, investor presentations, and strategic planning meetings.
-
Recommended For
Business executives, marketing managers, financial analysts, consultants, and strategic planners who need to present year-over-year performance comparisons. Suitable for market analysis, revenue trend analysis, market share presentations, and business development meetings where cumulative data visualization is required.
-
Slide Structure
Two-slide template featuring a left-side timeline with five circular nodes (2030–2050) and a right-side 100% stacked column chart with five bars representing two data series in navy blue and light blue. The diagonal background design emphasizes temporal flow. Each slide includes color theme variations (navy and green) for flexible presentation scenarios.
Related Products
-

Graph of Changes in Media Utilization
#Market and Competitor Analysis #Graph #Future Outlook
-

Diagram-based Wealth-Building Financial Planning Strategy – Setting Goals for Success
#Business Vision and Strategy #Operational Plan #Diagram
-

Goal and Strategy Arrow Diagram – Clarifying Business Objectives
#Business Vision and Strategy #Operational Plan #Diagram
-

Guiding Slide Representing Future Vision – Current Status of Business
#Company Introduction #Business Vision and Strategy #Business Strategy
