Blue Orange Table Chart for Visualizing Profit Structure – Suitable for Financial Planning
RJ0300090_22
- Last Update 05/14/2025
- File Size 0.3MB
- # of Slides 2
- File Format PPTX
- Slide Ratio 16:9
- Color
Keywords
- #Content-Based Slides
- #Design-Based Slides
- #Financial Plans and Performance
- #Diagram
- #Income Statement
- #Sales and Revenue
- #Table
- #Standard Table
- #16:9
- #table chart PowerPoint
- #dual table slide template
- #financial comparison template
- #revenue structure PowerPoint
- #data comparison slide
- #two-column table diagram
About the Product
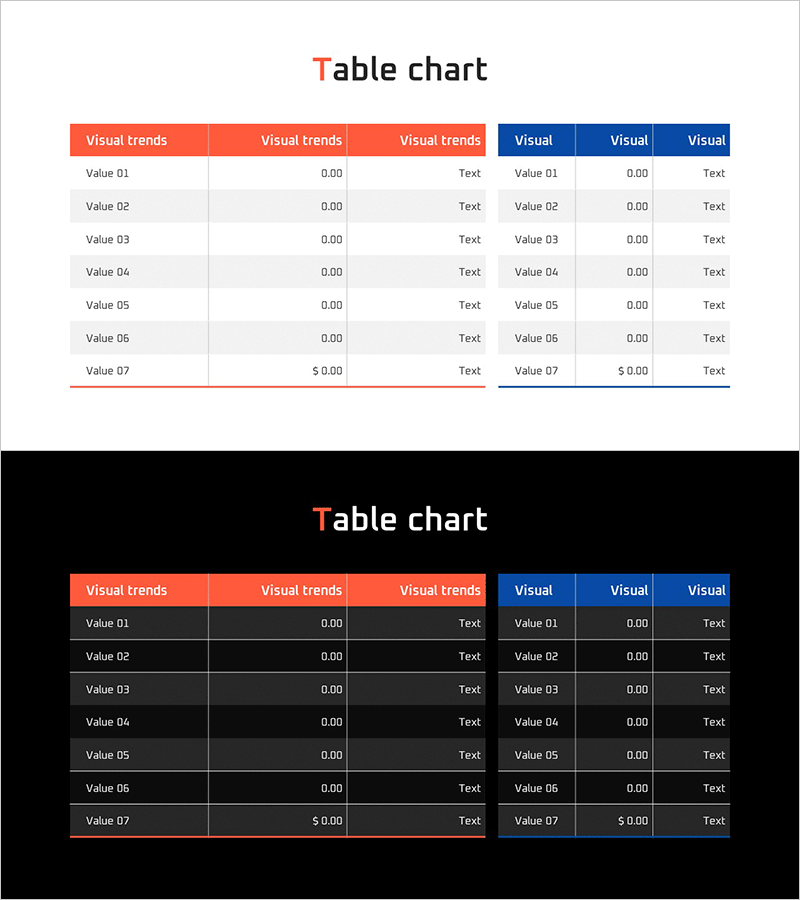
A professional dual-table chart PowerPoint slide designed for financial planning and revenue structure analysis. This 2-slide presentation features a side-by-side table layout with an orange header on the left and a blue header on the right, enabling direct comparison of two data categories. Each table contains 7 rows with clearly defined columns for item names, numerical values, and text descriptions. Two design versions are included: a light background variant for printed materials and a dark background variant for projector presentations. The PPTX format allows instant customization for financial reports, business plans, quarterly performance reviews, and budget comparisons.
Usage Points
-
Main Usage
Visualizes financial data and revenue structures in a side-by-side comparison format. Ideal for presenting budget versus actual results, planned versus achieved outcomes, or departmental revenue comparisons. The clearly defined numerical input areas enhance the credibility and clarity of financial information presentation.
-
How to Use
Open the slide and replace the row items and values with your own financial data. Assign the orange header table to one category (e.g., Plan) and the blue header table to another (e.g., Actual), then input corresponding figures. Use the light background version for printed handouts and the dark background version for projector-based presentations.
-
Recommended For
CFOs, finance managers, and executives presenting quarterly or annual financial performance. Suitable for financial forecast sections in business plans, revenue model explanations in investor pitch decks, and profit-and-loss statement analyses. Applicable to budget planning, cost management, and profitability analysis presentations.
-
Slide Structure
2-slide set. Each slide contains a title area at the top and a dual-table layout below. The left table features an orange header and the right table features a blue header, each with 3 columns. Both tables include 7 data rows for item entries and values. Slide 1 uses a light gray background; Slide 2 uses a black background for visual contrast and presentation flexibility.
Related Products
-

Visualizing Projected Income, Expenses, and Key Metrics by Business
#Financial Plans and Performance #Diagram #Text Box
-

Business Income Statement Slide - Highlighting Financial Performance
#Financial Plans and Performance #Diagram #Income Statement
-

Business Sales and Profit Calculation Table – Essential Slide for Financial Planning
#Financial Plans and Performance #Diagram #Income Statement
-

Illustration Theme Income Statement Table – A Fresh Perspective on Financial Data
#Financial Plans and Performance #Diagram #Income Statement
