Year-by-Year Comparative Analysis Line Graph – Providing Market Insights
RJ0300090_11
- Last Update 05/14/2025
- File Size 0.3MB
- # of Slides 2
- File Format PPTX
- Slide Ratio 16:9
- Color
Keywords
About the Product
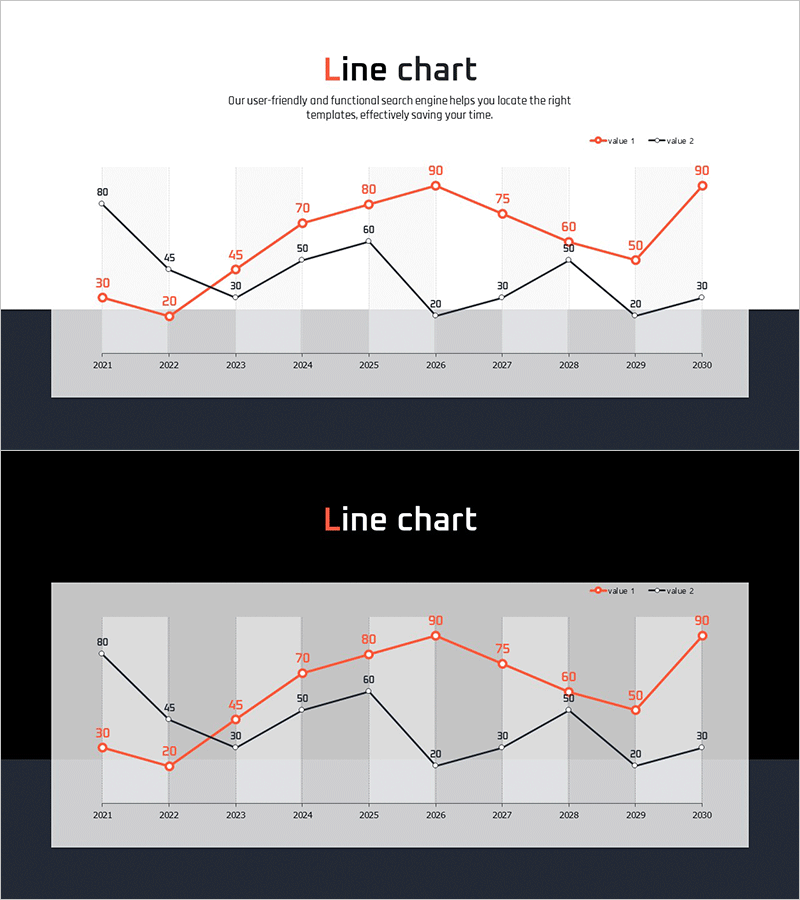
This free PowerPoint slide features a dual-series line chart comparing annual data from 2021 to 2030, using an orange-red series and a black series for clear visual contrast. Both a white-background and a dark black-background theme are included, so you can choose the version that best suits your presentation environment. Circular data point markers and numeric labels are displayed at each year, with gray vertical bands separating the annual intervals for easy reading. This presentation slide is ideal for inserting into annual performance reports, market trend analyses, competitive comparisons, and financial review decks. Simply replace the year labels and numeric values with your own data to complete the slide. For a wider collection of similar graph slides and chart templates, explore GoodPello's full library.
Usage Points
-
Main Usage
Designed to visually compare two data series across annual periods from 2021 to 2030 using a clear line chart format. Best suited for market trend analysis, annual performance reviews, and competitive benchmarking slides within business presentations.
-
How to Use
Replace the X-axis year labels and each data point value with your actual figures, then update the legend series names to match your comparison categories. Select either the white or dark background theme to match your presentation style and venue.
-
Recommended For
Recommended for business strategists preparing annual performance reports, marketers visualizing market trend data, consultants presenting competitive analysis, and financial analysts creating data-driven presentation decks.
-
Slide Structure
Single-slide layout with a dual-series line chart (orange-red and black) spanning 10 annual data points from 2021 to 2030, circular point markers with numeric labels, gray vertical interval bands, top-right legend, and both white and dark background theme versions included.
Related Products
-

Competitive Advantage Analysis Bar Chart – Data Visualization
#Free Graphs
-

Competitor Analysis and Market Trend Graph – Blue, Orange, Green Colors
#Free Graphs
-

Business Comparison Analysis Graph – Strengthening Market and Competitor Analysis
#Free Graphs
-

Data Visualization with Bar Charts – Presentation for Efficient Choices
#Free Graphs
