Science Experiment Schedule Connection Diagram
RJ0400019_9
- Last Update 05/22/2025
- File Size 0.9MB
- # of Slides 2
- File Format PPTX
- Slide Ratio 16:9
- Color
Keywords
- #Content-Based Slides
- #Design-Based Slides
- #Business Strategy
- #Operational Plan
- #Diagram
- #Step-by-Step Schedule Plan
- #Business Processes
- #Cluster
- #Chain Diagram
- #16:9
- #connection diagram PowerPoint
- #4-step process flow slide
- #business process diagram template
- #workflow visualization PPT
- #how to create process diagram in PowerPoint
About the Product
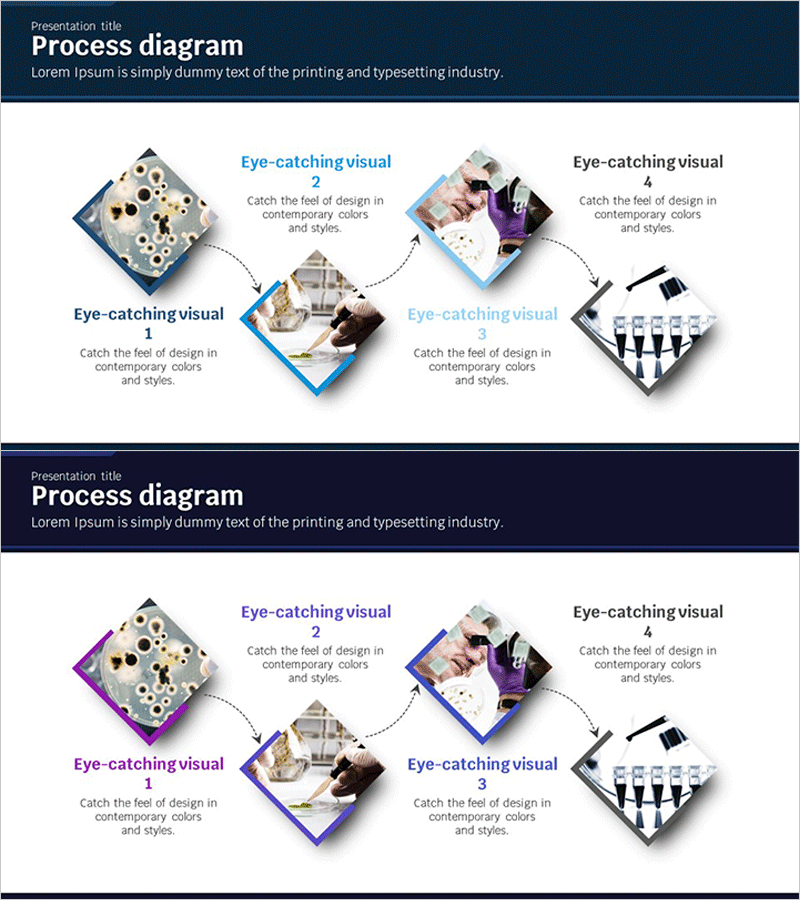
A 4-step connection diagram PowerPoint slide designed to visualize sequential processes from science experiment schedules to business strategy execution. Diamond-shaped nodes connected by directional arrows clearly represent workflow progression, with blue accent colors and white background enhancing information clarity. Each stage includes dedicated image insertion areas and text fields for immediate data integration into your presentation. The 16:9 widescreen format across 2 slides is ideal for project reports, operational planning documents, and strategic presentations.
Usage Points
-
Main Usage
Visualizes sequential processes, stage-by-stage workflows, and interconnected relationships with clarity and impact. Ideal for presenting science experiment progression, project timeline planning, business strategy execution phases, and operational process flows across 4 or more connected stages.
-
How to Use
Enter stage names and titles in each diamond node, insert relevant images or icons in the designated image areas, and add detailed descriptions in text boxes to enhance audience comprehension. Customize colors to highlight critical stages or duplicate nodes to expand beyond 4 steps as needed.
-
Recommended For
Science and education professionals presenting experimental procedures, project managers reporting timeline schedules, executives outlining strategic initiatives, operations teams proposing process improvements, and consultants explaining change management roadmaps.
-
Slide Structure
Four diamond nodes sequentially connected by dotted directional arrows. Each node features a square image insertion frame and accompanying text description area, with a title section at the top. Two-slide set includes blue accent version and purple accent version for design flexibility.
Related Products
-

Business Processes by Business Hours Slide – Efficient Operations Planning
#Business Strategy #Operational Plan #Diagram
-

Game Business Process Diagram - Visualization of Business Strategy
#Business Strategy #Operational Plan #Diagram
-

Business Process Diagram – Optimizing Workflow
#Business Strategy #Operational Plan #Diagram
-

Idea Meeting Process - Multidirectional Flow Diagram
#Business Strategy #Operational Plan #Diagram
