Decoding the 3 Embedded Keywords - Concept Visualization through Diagram
RB0800018_17
- Last Update 03/21/2025
- File Size 0.1MB
- # of Slides 2
- File Format PPTX
- Slide Ratio 4:3
- Color
Keywords
- #Content-Based Slides
- #Design-Based Slides
- #Product/Service Introduction
- #Technical Approach
- #Diagram
- #Composition
- #Service Components
- #Cluster
- #Inclusive Cluster Diagram
- #Chain Diagram
- #4:3
- #nested circle diagram PowerPoint
- #3-node concept visualization slide
- #inclusion relationship diagram
- #data visualization template
- #business presentation diagram download
About the Product
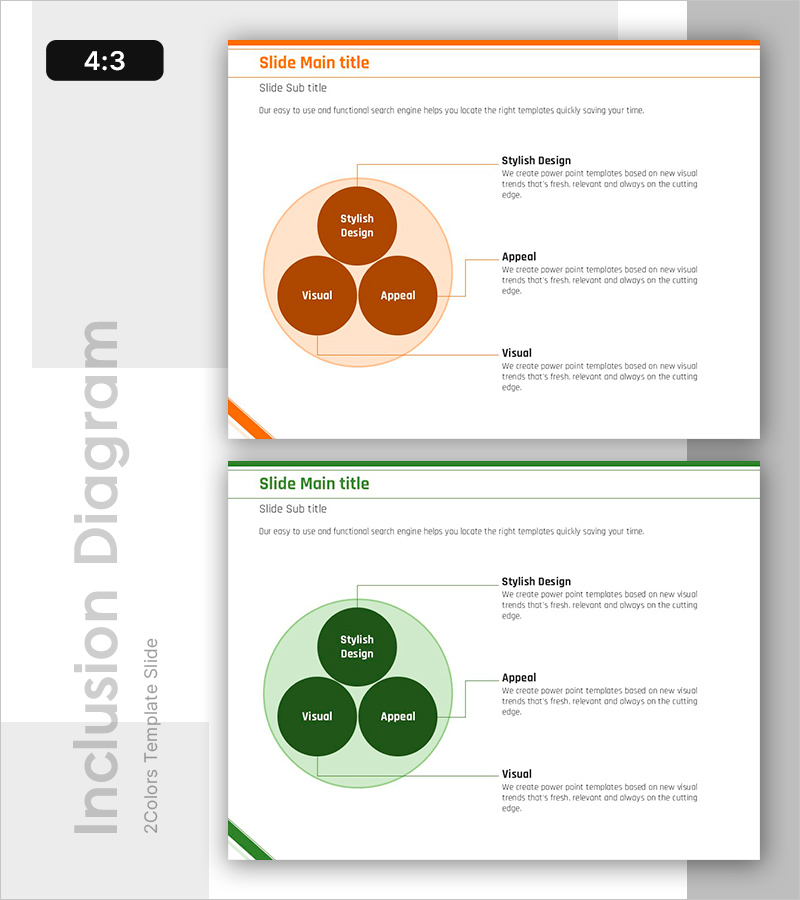
A PowerPoint slide template featuring a nested circular diagram that visualizes three core concepts with symmetrical arrangement. The central concept is surrounded by two supporting concepts on the left and right, effectively illustrating inclusion relationships and interconnections between ideas. Provided in both orange and green color schemes, each node includes text labels and dedicated explanation areas for immediate use in presentations. The 2-slide deck in 4:3 aspect ratio is ideal for business documents including data analysis, marketing strategy presentations, organizational structure explanations, and concept mapping in various professional contexts.
Usage Points
-
Main Usage
Optimized for visually explaining relationships and interactions between three core concepts. The symmetrical arrangement with central and supporting concepts enables balanced information delivery, while dedicated text areas in each node allow for detailed explanations and supporting data.
-
How to Use
Open the slide and replace the text in each circular node with your own concept names. Add detailed descriptions in the explanation boxes on the right side. Choose between orange or green color scheme, and optionally insert additional nodes or connecting arrows to emphasize relationships between concepts.
-
Recommended For
Marketing strategy presentations explaining target audience, messaging, and channel interactions; organizational structure diagrams showing divisional hierarchies and role relationships; data analysis reports visualizing correlations between key metrics; educational and seminar materials depicting conceptual hierarchies and learning frameworks.
-
Slide Structure
2-slide composition. Each slide contains a title area at the top, a central nested diagram with 3 circular nodes (1 center + 2 flanking), and 3 text explanation boxes on the right. Optimized for 4:3 aspect ratio with one orange version and one green version included.
Related Products
-

Visualizing Business Activities – Innovative Components
#Product/Service Introduction #Business Introduction #Diagram
-

Vibrant Color Box PPT Composition Contents
#Product/Service Introduction #Technical Approach #Diagram
-

Visualizing Power Plant Locations – Key Insights for the Energy Business
#Product/Service Introduction #Technical Approach #Diagram
-

Segmented Solutions: Streamlining Processes by Division
#Product/Service Introduction #Business Strategy #Diagram
