Financial Services Market Analysis Graph – Competitor Analysis and Sustainability
RJ0300084_11
- Last Update 05/12/2025
- File Size 0.2MB
- # of Slides 2
- File Format PPTX
- Slide Ratio 16:9
- Color
Keywords
- #Content-Based Slides
- #Design-Based Slides
- #Market and Competitor Analysis
- #Graph
- #Competitor Analysis
- #Market Analysis
- #Column
- #Grouped Column
- #16:9
- #grouped bar chart PowerPoint
- #3-series comparison graph slide
- #5-item data visualization template
- #market analysis chart PowerPoint
- #competitor analysis graph slide
About the Product
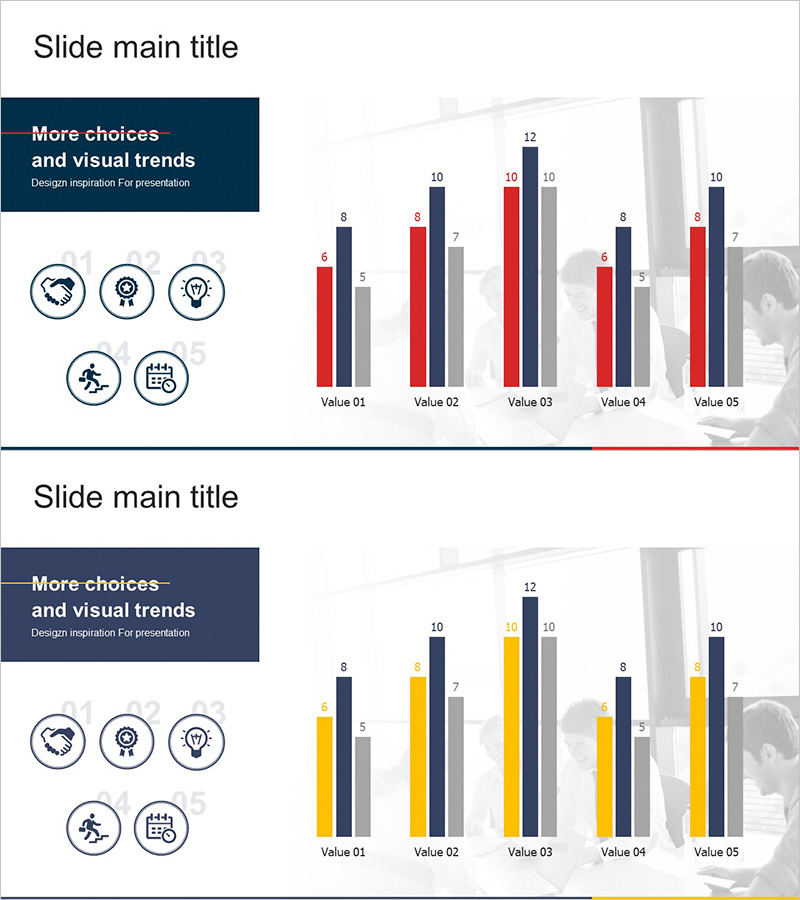
A grouped bar chart PowerPoint slide optimized for financial services market analysis and competitor comparison presentations. This slide displays data for 5 items (Value 01–05) across 3 series arranged side-by-side, enabling instant visual comparison of numerical values and ranking changes. The design uses a three-color palette of dark blue, red, and gray, with numeric labels (6–12) displayed above each bar for precise data communication. The left side features a dark blue box containing title and descriptive text, while the right side incorporates a background business image for visual balance. The 2-slide set allows repeated use of the same structure, and color schemes can be customized to accommodate various analytical scenarios and corporate branding requirements.
Usage Points
-
Main Usage
Used in financial services, market analysis, and competitor comparison presentations to simultaneously compare numerical data across multiple items and emphasize ranking variations. The side-by-side bar arrangement enables intuitive communication of relative magnitudes and rankings for each item.
-
How to Use
Edit data values (6–12) and item names (Value 01–05) in the slide master to reflect actual figures. Color schemes can be adjusted to match corporate branding guidelines, and title/description text is edited within the dark blue box. The 2-slide format is effective for presenting multiple analytical items in sequence.
-
Recommended For
Recommended for market analysis reports in finance, insurance, and securities industries; executive-level competitor analysis presentations; investor relations (IR) materials; business performance reports; and market overview sections in marketing strategy documents. Primary users include executives, business analysts, and marketing professionals requiring data-driven decision support.
-
Slide Structure
Each slide is divided into two sections: a left dark blue box (title and description area) and a right graph area. The chart comprises 5 items on the X-axis and 3 data series represented by bar colors, with numeric labels displayed above each bar. A subtle business background image on the right adds visual depth. Both slides maintain identical structure for consistent data presentation.
Related Products
-

Earth Analysis Bundle Vertical Bar Graph – Market and Competitor Analysis
#Market and Competitor Analysis #Graph #Competitor Analysis
-

Comparative Analysis Vertical Chart – Market and Competitor Analysis
#Market and Competitor Analysis #Graph #Competitor Analysis
-

Pill Market Analysis Vertical Bar Graph – Clear Visualization of Market Status
#Market and Competitor Analysis #Graph #Competitor Analysis
-

Grouped Bar Chart for Learning Categories
#Market and Competitor Analysis #Graph #Competitor Analysis
