Business Income Statement Table – Financial Performance Analysis
RJ0300088_14
- Last Update 05/13/2025
- File Size 0.8MB
- # of Slides 2
- File Format PPTX
- Slide Ratio 16:9
- Color
Keywords
- #Content-Based Slides
- #Design-Based Slides
- #Financial Plans and Performance
- #Diagram
- #Income Statement
- #Sales and Revenue
- #Table
- #Standard Table
- #16:9
- #income statement table PowerPoint
- #financial data slide template
- #profit and loss statement PPT
- #business table presentation
- #quarterly financial report slide
About the Product
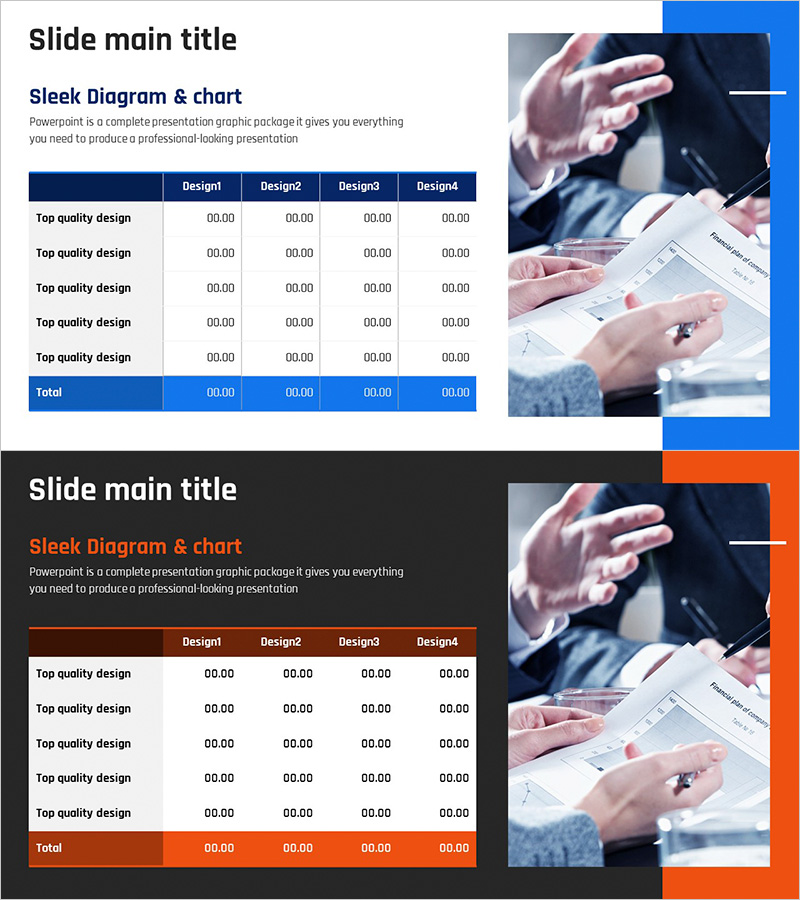
A professional income statement table PowerPoint slide designed for financial performance analysis and business reporting. This 2-slide set features a dark navy header row with white data cells, enabling clear presentation of revenue, expenses, and profit figures across four quarters or fiscal years. The 16:9 widescreen format integrates seamlessly with modern presentation environments, and all table elements—cell colors, text sizes, and data fields—are fully editable. Ideal for CFOs, financial analysts, and business leaders presenting quarterly or annual financial results to stakeholders, investors, and management teams.
Usage Points
-
Main Usage
Presents financial performance metrics—revenue, costs, and net profit—in a structured tabular format. This slide enables clear communication of financial status to executives, investors, and stakeholders by organizing quarterly or annual data in an easy-to-read comparison layout.
-
How to Use
Insert this slide into business plans, financial reports, or investor pitch decks in the financial analysis section. Enter period names (quarters or years) in the header row and corresponding financial figures in each data cell. Customize cell colors and font sizes to emphasize key metrics or highlight year-over-year changes.
-
Recommended For
CFOs, financial controllers, business executives, startup founders, and investor relations professionals. Suitable for banks, insurance companies, manufacturing firms, and distribution businesses that require data-driven financial reporting and quarterly performance reviews.
-
Slide Structure
A 5-row by 4-column table with a dark navy header row (white text) and four data rows (light gray background, black text). The leftmost column contains category labels (revenue, expenses, profit), while the four right columns represent Design1–Design4 (quarters or fiscal years). A business meeting photograph positioned in the upper right provides visual context and professional appearance.
Related Products
-

Business Sales and Profit Calculation Table – Essential Slide for Financial Planning
#Financial Plans and Performance #Diagram #Income Statement
-

Illustration Theme Income Statement Table – A Fresh Perspective on Financial Data
#Financial Plans and Performance #Diagram #Income Statement
-

Sleek Infographic: Modern Colors and Chart Slide Design
#Financial Plans and Performance #Diagram #Income Statement
-

Bank Income Statement – Visualizing Financial Performance
#Financial Plans and Performance #Diagram #Income Statement
