South America Target Region Achievement Rate – Market and Strategy Analysis
RJ0700016_26
- Last Update 07/26/2025
- File Size 0.5MB
- # of Slides 2
- File Format PPTX
- Slide Ratio 16:9
- Color
Keywords
- #Content-Based Slides
- #Design-Based Slides
- #Market and Competitor Analysis
- #Marketing Plan and Strategy
- #Graph
- #Other
- #Target Market
- #Target Market Strategy
- #Circles
- #Doughnut Chart
- #16:9
- #donut chart PowerPoint slide
- #pie chart template
- #regional achievement rate visualization
- #marketing analysis presentation
- #map-integrated data visualization
About the Product
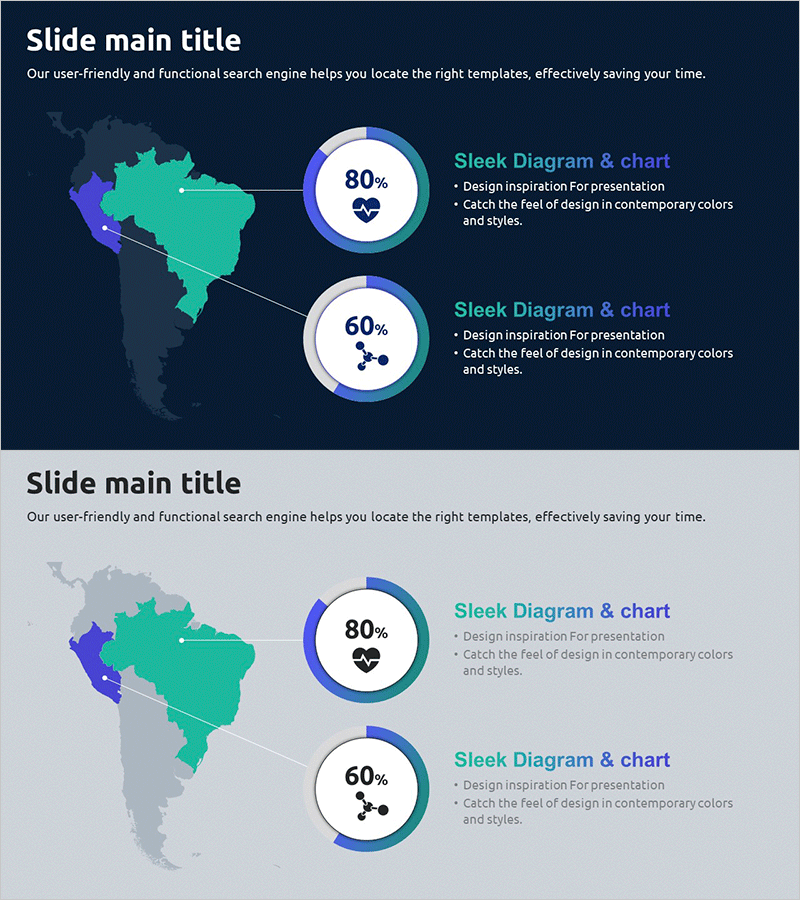
A donut chart PowerPoint slide visualizing South America's target achievement rates by region. Designed with a dark navy background, turquoise and purple-toned regional map, and two donut-shaped pie charts displaying 80% and 60% achievement rates. Text description areas positioned beside each chart support market analysis and strategic planning presentations. Available in 16:9 PPTX format for immediate editing and customization across various regional performance comparison presentations.
Usage Points
-
Main Usage
Visualizes regional performance metrics using donut charts to display achievement rates at a glance. Connection lines between map and charts intuitively link regions to numerical data, making it effective for market analysis and strategic planning presentations.
-
How to Use
Use in marketing strategy presentations, regional sales performance reports, and market expansion plan presentations to emphasize target achievement rates. Edit chart percentages and text descriptions with your own data for immediate deployment.
-
Recommended For
Marketing managers, sales directors, business report creators, and international business strategy planners. Particularly useful for regional expansion plans, global market analysis, and performance evaluation presentations.
-
Slide Structure
Two-slide composition featuring South America map with turquoise and purple regional divisions, two donut-shaped pie charts (80% and 60% achievement rates), connecting lines, and text description areas on each slide. Optimized for 16:9 widescreen format.
Related Products
-

Graph of the Status of European Target Region Analysis – Market Trends Visualization
#Market and Competitor Analysis #Marketing Plan and Strategy #Graph
-

Slide Visualizing America with Contemporary Colors
#Market and Competitor Analysis #Marketing Plan and Strategy #Graph
-

European Market Share Analysis Graph
#Market and Competitor Analysis #Marketing Plan and Strategy #Graph
-

Analysis of European Target Regions – Insights for Marketing Strategy Development
#Market and Competitor Analysis #Marketing Plan and Strategy #Graph
