European Market Share Analysis Graph
RJ0400050_18
- Last Update 05/31/2025
- File Size 0.7MB
- # of Slides 2
- File Format PPTX
- Slide Ratio 16:9
- Color
Keywords
- #Content-Based Slides
- #Design-Based Slides
- #Market and Competitor Analysis
- #Marketing Plan and Strategy
- #Graph
- #Other
- #Target Market
- #Target Market Strategy
- #Circles
- #Doughnut Chart
- #16:9
- #donut chart PowerPoint slide
- #pie chart template download
- #market share analysis presentation
- #two-color ratio comparison
- #European market data visualization
About the Product
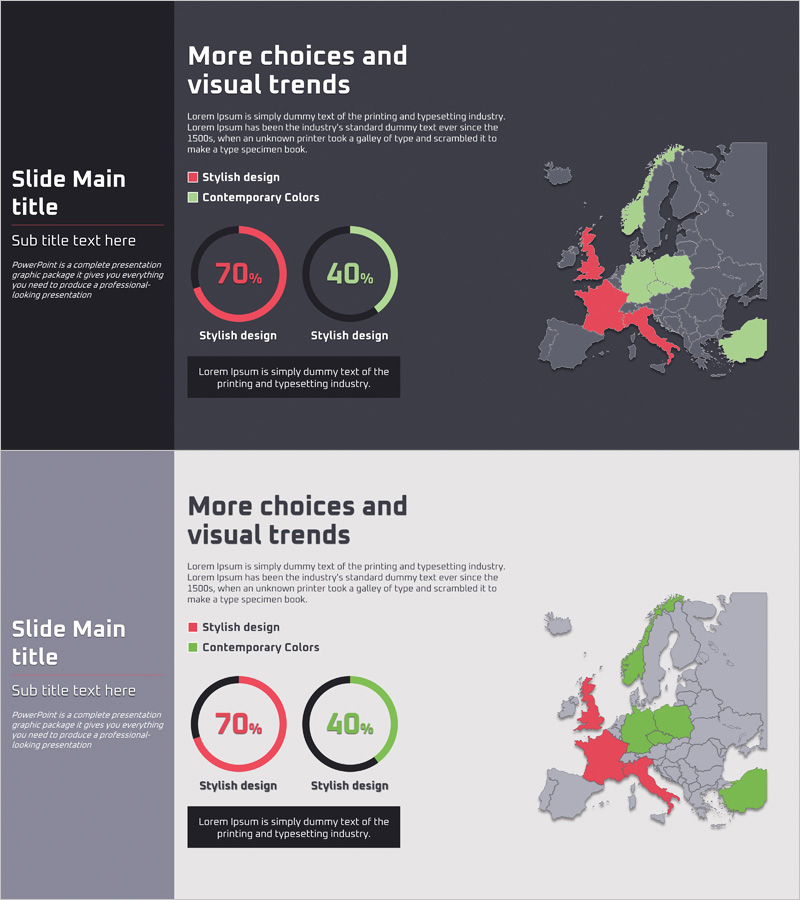
A two-slide donut chart PowerPoint template designed for European market share analysis and regional data visualization. Features red and green color-coded pie segments displaying contrasting percentages (70% and 40%) against a dark background with high-contrast white typography. The world map overlay provides geographic context for distribution analysis. This presentation slide set combines contemporary color palette with data-driven design, making it ideal for business reports, market analysis decks, and investor presentations. Fully editable PPTX format ready for immediate customization.
Usage Points
-
Main Usage
Visualizes proportional data across two categories using donut segments, ideal for market share, sales distribution, customer composition, or regional breakdown. The hollow center accommodates key metrics, percentages, or legend information without cluttering the chart.
-
How to Use
Insert into business reports, marketing strategy presentations, quarterly earnings decks, or investor pitch materials. Replace percentages and labels with your own data. Use the geographic map context for global market analysis or regional performance comparisons across different business segments.
-
Recommended For
Marketing managers, business analysts, financial professionals, and executives presenting market research findings, sales performance, or competitive positioning. Particularly effective for international business presentations, regional strategy discussions, and cross-market comparison reports.
-
Slide Structure
Two-slide set with dark and light background versions. Each slide contains dual donut charts (70% and 40% segments), world map visualization, title area, legend box, and descriptive text field. All elements are independently editable and repositionable.
Related Products
-

Graph of the Status of European Target Region Analysis – Market Trends Visualization
#Market and Competitor Analysis #Marketing Plan and Strategy #Graph
-

Target Market Development Status Graph – Market Analysis and Strategy
#Market and Competitor Analysis #Marketing Plan and Strategy #Graph
-

Infographic Slide for Regional Data Visualization
#Market and Competitor Analysis #Marketing Plan and Strategy #Graph
-

Analysis of European Target Regions – Insights for Marketing Strategy Development
#Market and Competitor Analysis #Marketing Plan and Strategy #Graph
