Target Area Analysis Graph – Market Segmentation and Strategy
RJ0300077_8
- Last Update 05/10/2025
- File Size 1.5MB
- # of Slides 2
- File Format PPTX
- Slide Ratio 16:9
- Color
Keywords
- #Content-Based Slides
- #Design-Based Slides
- #Market and Competitor Analysis
- #Marketing Plan and Strategy
- #Graph
- #Other
- #Target Market
- #Target Market Strategy
- #Map
- #16:9
- #regional analysis map PowerPoint
- #market segmentation slide
- #target area analysis graph
- #Europe map PPT template
- #marketing strategy map slide
About the Product
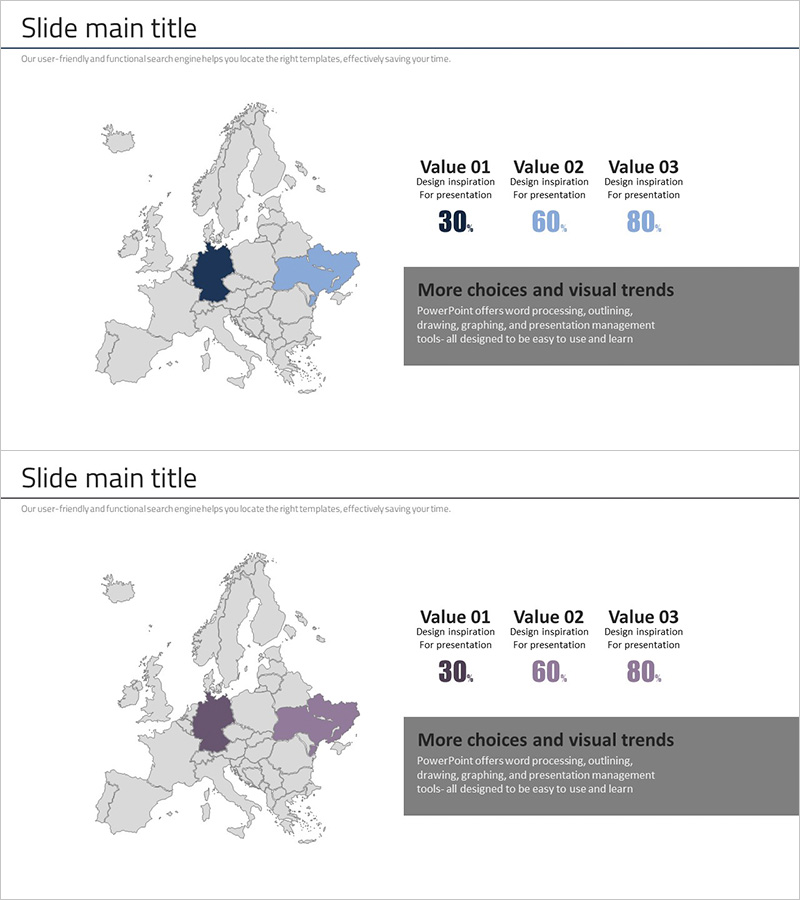
A map-based PowerPoint slide for analyzing European markets by region at a glance. The gray base map highlights regions using three color schemes—dark blue, light blue, and purple—to visually represent target market segmentation and competitive landscape analysis. The right side features a Value 01–03 comparison area with supporting text boxes, enabling data-driven decision-making during marketing strategy presentations. This two-slide PowerPoint template applies different color combinations to each slide, making it adaptable for various presentation scenarios and regional focus areas.
Usage Points
-
Main Usage
Visualize regional market conditions, target market segmentation, and competitor distribution using map-based graphics to support marketing strategy development and decision-making. Ideal for investor and partner presentations explaining market entry strategies by region.
-
How to Use
Highlight regions on the Europe map using distinct colors, then input regional market size, market share, or growth rate data in the Value fields on the right. Complete the slide by adding regional strategies, opportunities, and risk factors in the text box area.
-
Recommended For
Marketing managers, strategic planning teams, and sales executives presenting market analysis results to executives, investors, and partners. Particularly effective for Europe expansion strategies, regional business growth initiatives, and competitive benchmarking presentations.
-
Slide Structure
Two-slide layout with each slide divided into a left map area (non-editable) and right data section (three Value fields plus descriptive text box). Different color combinations (blue and purple) allow repeated use of the same structure, with flexible editing of regional highlight colors and numeric font sizes.
Related Products
-

Visualizing Country Design Preferences with Rectangle Diagrams
#Market and Competitor Analysis #Marketing Plan and Strategy #Graph
-

Area Graph for Competitor Analysis
#Market and Competitor Analysis #Marketing Plan and Strategy #Graph
-

European Target Country Analysis Graph – Strategic Market Insights
#Market and Competitor Analysis #Marketing Plan and Strategy #Graph
-

Slide Visualizing America with Contemporary Colors
#Market and Competitor Analysis #Marketing Plan and Strategy #Graph
