Business Icon Diagram – Visualization for Market and Competitor Analysis
RJ0300078_18
- Last Update 05/10/2025
- File Size 1.8MB
- # of Slides 2
- File Format PPTX
- Slide Ratio 16:9
- Color
Keywords
- #Content-Based Slides
- #Design-Based Slides
- #Product/Service Introduction
- #Market and Competitor Analysis
- #Diagram
- #Development Status
- #Market Analysis
- #Cluster
- #Chain Diagram
- #16:9
- #connected diagram PowerPoint
- #business icon slide template
- #market analysis diagram
- #competitor analysis slide
- #node connection PowerPoint template
About the Product
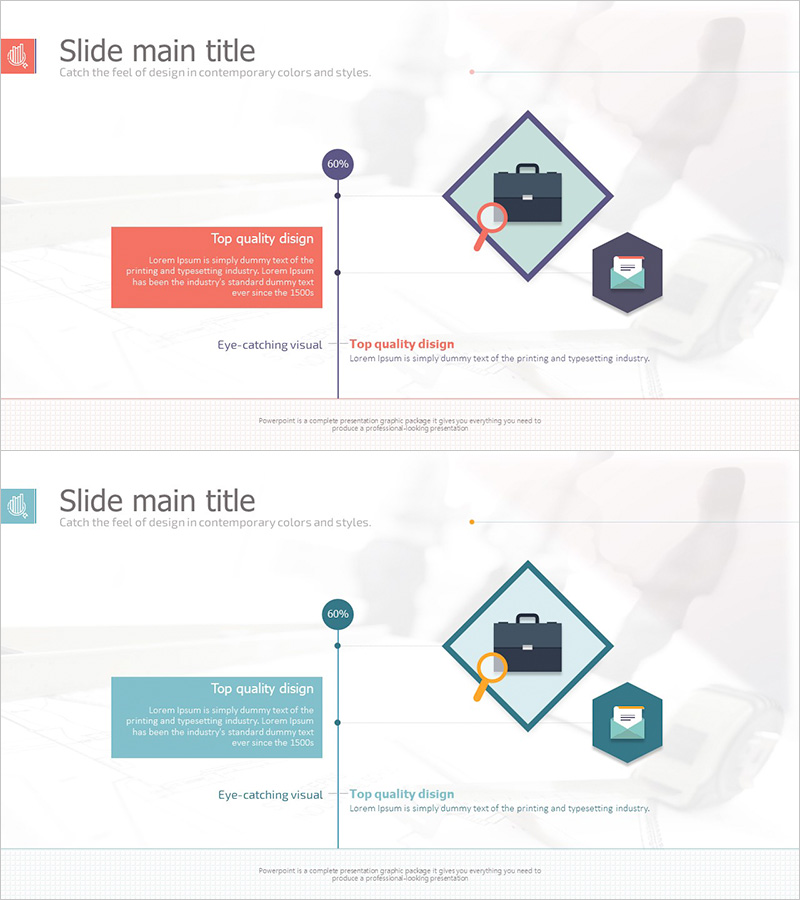
A connected diagram PowerPoint slide designed for market and competitor analysis visualization. The layout features three nodes linked along a central vertical axis, with a progress indicator (60%), text box, and business icons that clearly illustrate relationships between business concepts. Two color versions—coral and teal—are provided to suit different presentation themes. Each version uses text boxes and icons to establish information hierarchy. This 2-slide set is ready to use in business presentations covering market analysis, competitive analysis, and development status.
Usage Points
-
Main Usage
This diagram is optimized for visually representing connections between business concepts. Three key items—market analysis, competitor analysis, and development status—are linked along a central axis to clearly convey information flow. The progress indicator and icons emphasize the importance of each stage.
-
How to Use
Select text boxes and icons in the slide master and replace them with your content. Choose between the coral or teal version based on your presentation theme, then edit the text and icons at each node. Adjust the progress indicator (60%) to match your actual progress, and duplicate existing elements to add more nodes if needed.
-
Recommended For
Ideal for executive reports, business plan presentations, marketing strategy meetings, and product development updates. Particularly effective for business analysts, marketing managers, project managers, and management consultants explaining data-driven decisions. Suitable for internal corporate meetings and client presentations across various business contexts.
-
Slide Structure
Two-slide set with identical connected diagram layouts. Each slide features three nodes arranged along a central vertical axis: a progress badge at the top (60%), a text box in the center (coral or teal), and business icons (briefcase, envelope) on the right. Each node is independently editable with customizable text and colors.
Related Products
-

Arrow Map to Illustrate Distribution Strategy - Market Analysis
#Market and Competitor Analysis #Marketing Plan and Strategy #Diagram
-

Global Market Snapshot – Market Analysis and Outlook
#Company Introduction #Market and Competitor Analysis #Diagram
-

Market Segmentation Linkage Diagram - Market Analysis and Insights
#Market and Competitor Analysis #Diagram #Market Analysis
-

System Development Status Graph – Visualizing Market Share
#Product/Service Introduction #Market and Competitor Analysis #Diagram
