Detailed Bar Graph – Market and Competitor Analysis
RJ0300076_21
- Last Update 05/10/2025
- File Size 7.2MB
- # of Slides 2
- File Format PPTX
- Slide Ratio 16:9
- Color
Keywords
About the Product
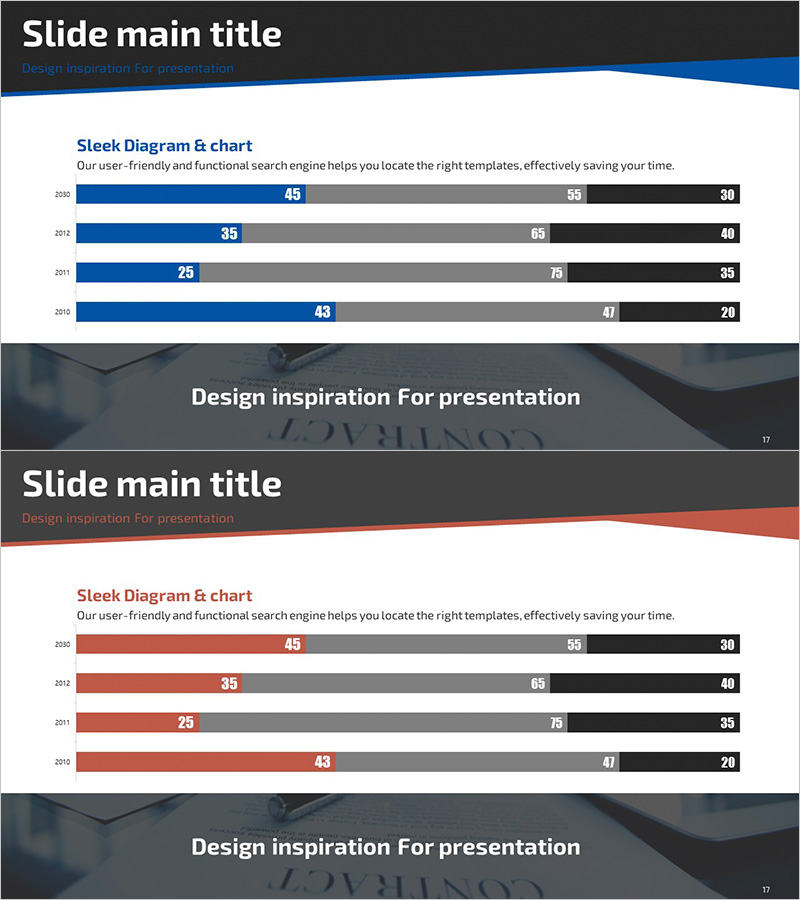
A horizontal bar chart PowerPoint slide optimized for market and competitor analysis presentations. This 2-slide set features a dark background with blue and red accent colors, displaying year-over-year data across three metrics in a parallel comparison layout. Each bar includes clear numerical labels for excellent data readability, with ample title and description text areas for immediate use in business presentations. Delivered in 16:9 widescreen PPTX format compatible with all presentation environments.
Usage Points
-
Main Usage
Designed to visualize year-over-year and category-based data across three metrics in parallel comparison format. Effectively communicates quantitative data such as market size, market share, and growth rates, making it ideal for competitive performance analysis. Helps investors and executives quickly grasp market opportunities and competitive positioning in a single view.
-
How to Use
Slide 1 contains the main chart with title, description text, and four years of data across three metrics. Slide 2 provides an alternative color scheme (red accent) with identical layout. Double-click each bar value to edit directly, or copy-paste data from Excel to update figures. Title, legend, and axis labels are fully customizable.
-
Recommended For
Recommended for market analysis sections in marketing plans, business reports, and investment pitch decks. Ideal for sales team competitive landscape presentations, executive briefings, and client proposals. Particularly suited for finance, consulting, and manufacturing industries where quantitative analysis is critical.
-
Slide Structure
Each slide contains a title area (1 line), description text area (2 lines), and a horizontal bar chart displaying 4 years × 3 metrics (12 bars total). Numerical labels appear above each bar, with a legend positioned on the right for clear information hierarchy. The dark background ensures excellent readability in both print and screen presentations.
Related Products
-

Mobile Services Market Analysis Bar Graph
#Market and Competitor Analysis #Graph #Competitor Analysis
-

Space Industry Development Status Graph – Key to Market Analysis
#Market and Competitor Analysis #Graph #Competitor Analysis
-

Big Data Cloud Analysis Graph – Market Competition Analysis
#Market and Competitor Analysis #Graph #Competitor Analysis
-

Global Business Analysis Graph – Market and Competitor Analysis
#Market and Competitor Analysis #Graph #Competitor Analysis
