Target Area Market Share Analysis Graph
RJ0300076_19
- Last Update 05/10/2025
- File Size 1MB
- # of Slides 2
- File Format PPTX
- Slide Ratio 16:9
- Color
Keywords
- #Content-Based Slides
- #Design-Based Slides
- #Market and Competitor Analysis
- #Graph
- #Other
- #Market Analysis
- #Target Market
- #16:9
- #target market analysis PPT slide
- #regional market share graph PowerPoint
- #Europe map market analysis presentation
- #geographic data visualization slides
- #how to create market share comparison in PowerPoint
About the Product
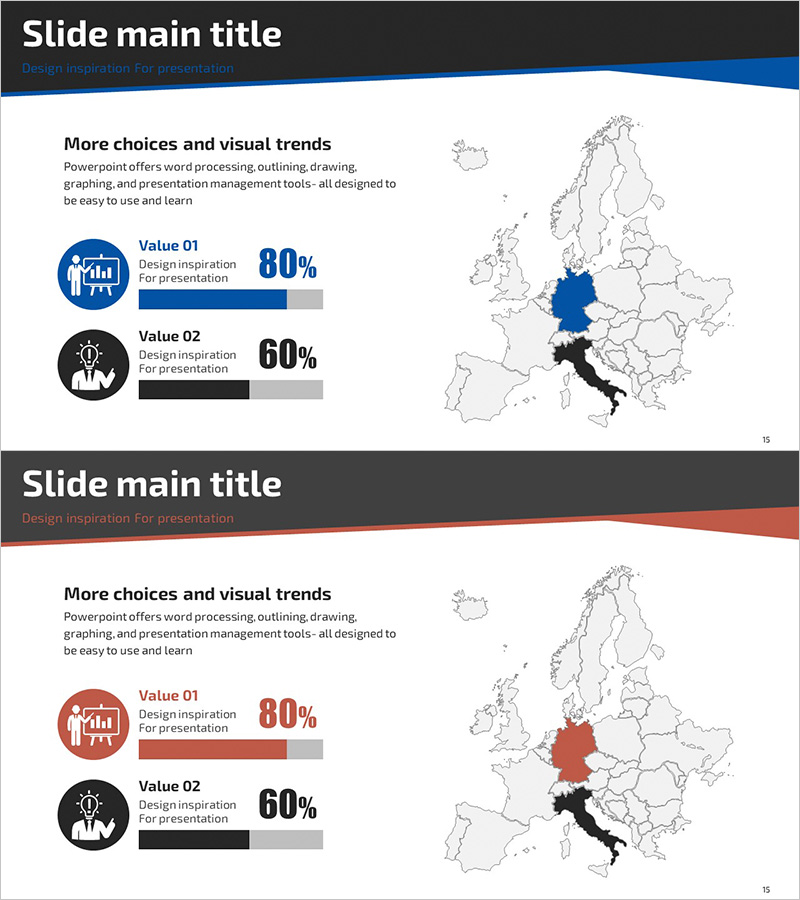
A market analysis PowerPoint slide combining a Europe map with bar graphs to visualize regional market share. This 2-slide set offers blue and red color themes, with each slide displaying regional penetration rates through map highlighting and numerical data simultaneously. The left side features icons and two value indicators with percentage input fields, while the right side shows a Europe map with specific countries highlighted. Ideal for business reports, investor presentations, and market analysis decks where regional market conditions need clear visual communication.
Usage Points
-
Main Usage
Visualize regional market share, sales performance, and customer distribution through combined map and numerical data representation. Communicate regional business results clearly to investors, partners, and management teams for informed decision-making.
-
How to Use
Enter metric names in the left icon area and update percentage values. Select target countries on the map and apply colors to highlight regional market share visually. Choose between blue or red color themes to match your corporate branding.
-
Recommended For
Market analysis sections, regional business performance reports, global expansion strategy presentations, investor pitch decks, and quarterly or annual business reviews. Effective for marketing teams, sales departments, executives, and investor audiences.
-
Slide Structure
2-slide layout with header (title and subtitle), left information panel (2 icons + metric labels + percentage input fields), and right map panel (Europe map + highlighted country color indicators). Contains 4 text input areas, 2 numerical input fields, and 1 map highlighting zone.
Related Products
-

Target Market Year-to-Year Comparison Analysis – Visualizing Market Trends
#Market and Competitor Analysis #Graph #Other
-

Horizontal Bar Chart Visualizing US Target Market Progress
#Market and Competitor Analysis #Graph #Other
-

European Target Market Analysis Bar Graph – Market Vision and Opportunities
#Market and Competitor Analysis #Graph #Other
-

Bathroom Demand Survey Graph – Donut Chart for Market Analysis
#Market and Competitor Analysis #Graph #Other
