Target Market Share Analysis Graph - Outstanding Business Insights
RJ0400052_29
- Last Update 05/31/2025
- File Size 7MB
- # of Slides 2
- File Format PPTX
- Slide Ratio 16:9
- Color
Keywords
- #Content-Based Slides
- #Design-Based Slides
- #Market and Competitor Analysis
- #Graph
- #Other
- #Market Analysis
- #Target Market
- #Circles
- #Pie Chart
- #16:9
- #pie chart PowerPoint slide
- #market share analysis graph
- #2-segment pie chart template
- #business data visualization PowerPoint
- #global market presentation slide
About the Product
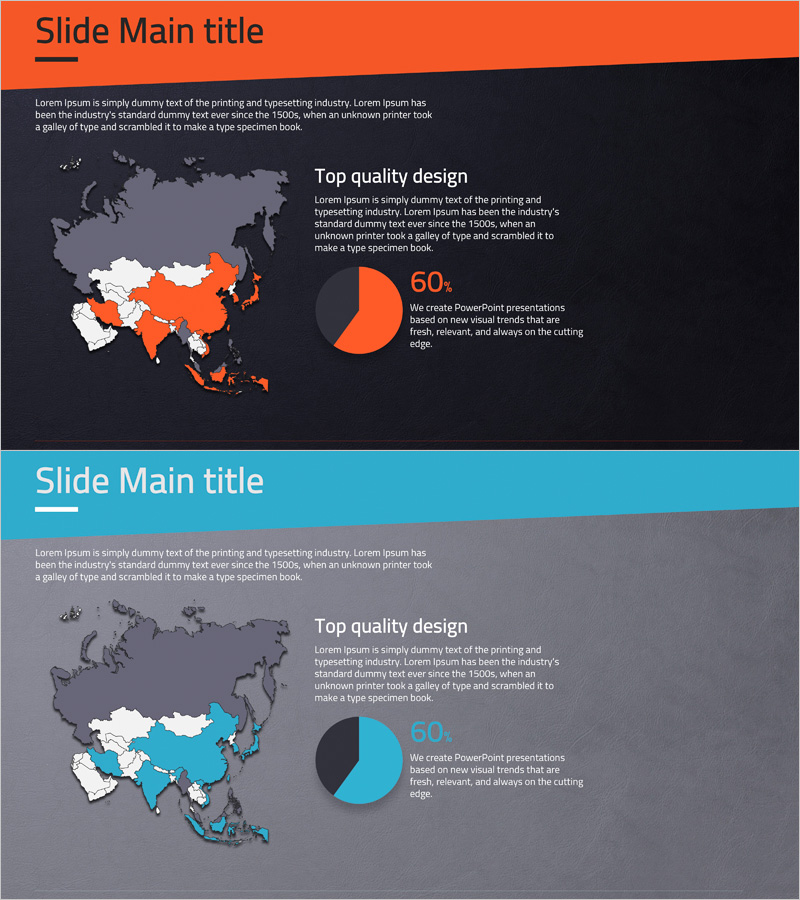
A two-segment pie chart PowerPoint slide designed for global market share analysis and regional performance comparison. The contrasting orange and teal color scheme clearly distinguishes data proportions, while the world map overlay provides geographic context for market positioning. This 16:9 widescreen template includes 2 slides with fully editable data fields, percentage labels, and text areas. Ideal for executive presentations, quarterly business reviews, marketing strategy sessions, and investor pitches where market analysis results need to be communicated with visual clarity and professional impact.
Usage Points
-
Main Usage
Visualize market share distribution, regional sales ratios, competitive positioning, and segment performance using proportional pie chart representation. The world map integration enables simultaneous geographic context, making it ideal for presenting multi-region business metrics and market penetration analysis at a glance.
-
How to Use
Slide 1 features a full layout with title, descriptive text, world map, and pie chart positioned side-by-side. Slide 2 provides an enlarged pie chart view for detailed focus. Double-click any data field, percentage label, or text box to edit with your own figures. Adjust colors via the theme palette without affecting the overall design structure.
-
Recommended For
Executive dashboards, quarterly earnings reports, marketing strategy presentations, investor relations meetings, management consulting proposals, and market research briefings. Particularly valuable for business development managers, marketing directors, financial analysts, C-suite executives, and strategy consultants presenting market analysis to stakeholders.
-
Slide Structure
Slide 1: Orange header section with title and descriptive text; dark background content area with world map on left side and pie chart on right side, with 60% metric prominently displayed. Slide 2: Enlarged pie chart layout. Two-segment circular graph with editable percentage labels, legend text, and data entry fields for each segment.
Related Products
-

Target Market Share Analysis Graph – Strategic Market Insights
#Market and Competitor Analysis #Graph #Other
-

Target Market Analysis Data Table - Market Growth Statistics
#Market and Competitor Analysis #Graph #Other
-

Gender Ratio Customer Analysis 3D Circle Graph – Insights for Market Understanding
#Market and Competitor Analysis #Graph #Other
-

Business Plan Presentation Template - Asia Map
#Market and Competitor Analysis #Diagram #Other
