Business Income Statement Table – Visualizing Financial Performance
RJ0300076_18
- Last Update 05/10/2025
- File Size 1.2MB
- # of Slides 2
- File Format PPTX
- Slide Ratio 16:9
- Color
Keywords
About the Product
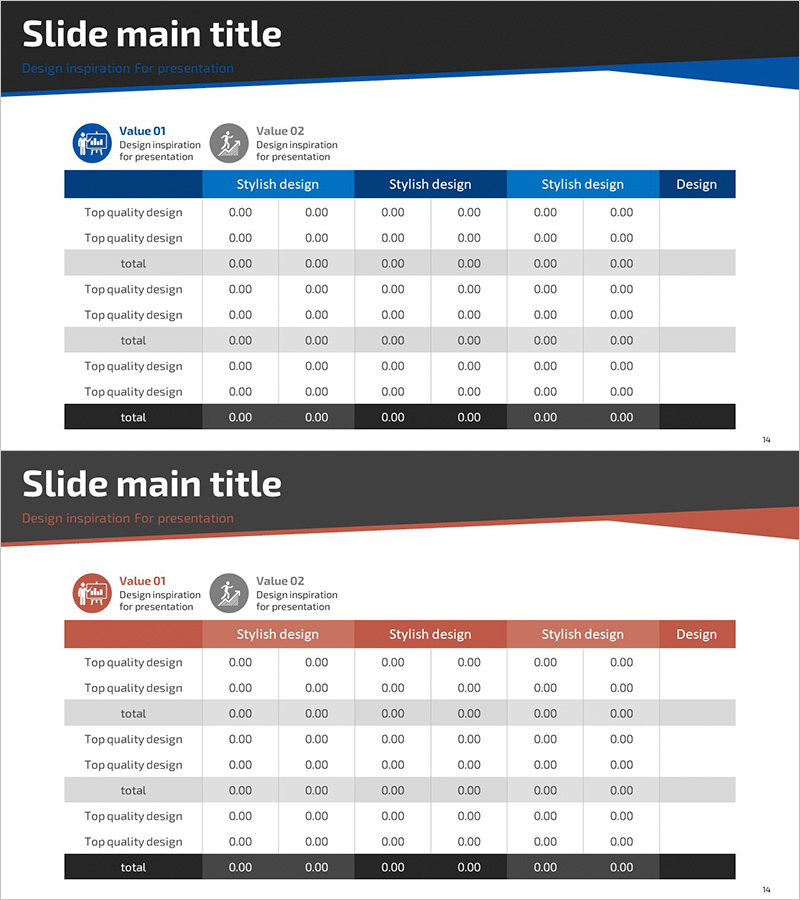
A PowerPoint slide template for visualizing business income statements with clear financial data presentation. Features a dark header and white background providing strong contrast for effective number readability. The 6-column table structure enables quarter-by-quarter and year-over-year financial performance comparison at a glance. Value 01 and Value 02 icons at the top highlight key metrics, while middle and bottom sections support multi-layered information architecture. Ready-to-use presentation slide for investor reports, IR materials, and executive briefings.
Usage Points
-
Main Usage
Visualize quarterly and annual income statement figures in a clear table format to effectively communicate financial performance to executives, investors, and stakeholders. High contrast between dark header and white background maximizes numerical readability and data comprehension.
-
How to Use
Enter key financial metrics (revenue, operating profit, etc.) in the top Value 01 and Value 02 sections. Fill the central table with quarterly or annual income statement line items. Complete the multi-layer structure by adding analysis or summary content in the bottom section.
-
Recommended For
CFOs, finance managers, and executives use this slide for investor presentations, quarterly earnings calls, and executive briefing meetings. Ideal for startup IR decks, corporate financial reports, and bank loan application materials requiring credible financial data visualization.
-
Slide Structure
2-slide set: Slide 1 features blue header with 6-column table layout; Slide 2 has red header with identical table structure. Each slide contains 2 Value icons at top, multi-row table in center, and additional information area at bottom in 3-tier composition.
Related Products
-

Mobile Finance Business Sales and Profit Statement – Transparent Financial Performance
#Financial Plans and Performance #Diagram #Income Statement
-

Sales and Bills Slide for Navigation App
#Financial Plans and Performance #Diagram #Income Statement
-

Transportation Business Sales and Profit Table – Financial Analysis
#Financial Plans and Performance #Diagram #Income Statement
-

Sales and Profit Table – Clear Visualization of Financial Planning
#Financial Plans and Performance #Diagram #Other
