Comparison of Regional Distribution by Year – Market Analysis and Strategy
RJ0300074_25
- Last Update 05/09/2025
- File Size 1MB
- # of Slides 2
- File Format PPTX
- Slide Ratio 16:9
- Color
Keywords
- #Content-Based Slides
- #Design-Based Slides
- #Market and Competitor Analysis
- #Marketing Plan and Strategy
- #Graph
- #Other
- #Market Analysis
- #Target Market Strategy
- #16:9
- #regional distribution comparison PowerPoint
- #year-over-year market analysis slide
- #geographic growth chart PPT
- #how to create a regional distribution map in PowerPoint
- #market expansion presentation template
About the Product
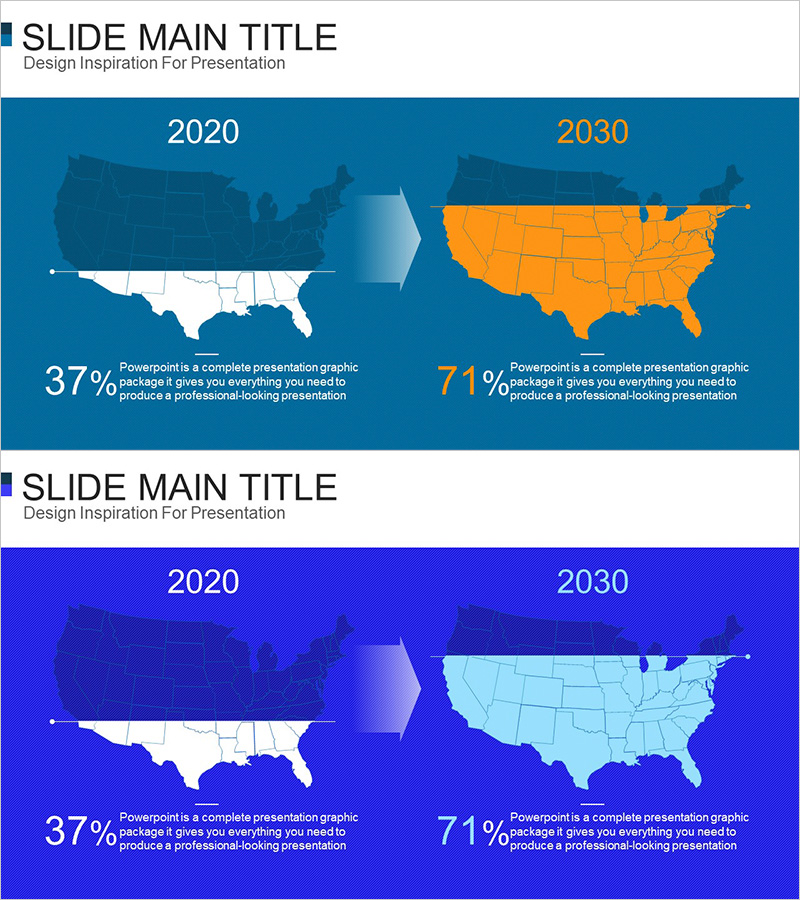
A PowerPoint slide that visually compares regional distribution changes between 2020 and 2030 using U.S. maps in contrasting color schemes. The first slide uses dark blue and white versus blue and light blue; the second uses dark blue and white versus orange to highlight market expansion trends across regions. Growth metrics (37% to 71%) are displayed numerically beneath each map to strengthen presentation impact. This 16:9 widescreen 2-slide presentation is ready for immediate use in market analysis, marketing strategy, and business planning presentations.
Usage Points
-
Main Usage
This slide visually compares regional market expansion trends over time using contrasting map colors. The 2020 baseline and 2030 target states are clearly differentiated, while numerical data (37% to 71%) reinforces the growth narrative and strengthens audience persuasion.
-
How to Use
Use this slide in the market analysis section when discussing regional growth strategies. It is effective for investor pitches, business plans, and marketing proposals that present geographic expansion roadmaps. The side-by-side comparison of current state and future goals supports executive decision-making.
-
Recommended For
Marketing managers, business planning teams, investor relations professionals, and executives developing regional expansion strategies will find this slide most useful. It is particularly effective when presenting regional market share shifts, new market entry plans, and business growth timelines.
-
Slide Structure
The slide is divided into three sections: left side shows 2020 baseline map (dark blue and white), center displays a transition arrow, and right side presents 2030 target map (orange and light blue). Growth percentage and descriptive text appear below each map, enabling data-driven comparative analysis.
Related Products
-

Country Analysis Map Graph for Market Insights
#Market and Competitor Analysis #Marketing Plan and Strategy #Graph
-

Graph of Sales by Region – Visualizing Market Status
#Market and Competitor Analysis #Graph #Other
-

Regional Demand Comparison Graph
#Market and Competitor Analysis #Graph #Other
-

Residential Lighting Graph – Market Analysis
#Market and Competitor Analysis #Graph #Other
