Current Status of Global Target Market Analysis – Strategic Insights through Data Visualization
RJ0300034_17
- Last Update 04/27/2025
- File Size 6MB
- # of Slides 2
- File Format PPTX
- Slide Ratio 16:9
- Color
Keywords
- #Content-Based Slides
- #Design-Based Slides
- #Company Introduction
- #Marketing Plan and Strategy
- #Graph
- #Other
- #Global Network
- #Target Market Strategy
- #Map
- #16:9
- #global map PowerPoint slide
- #market analysis map presentation
- #regional data visualization slide
- #global market analysis PPT
- #world map chart template
About the Product
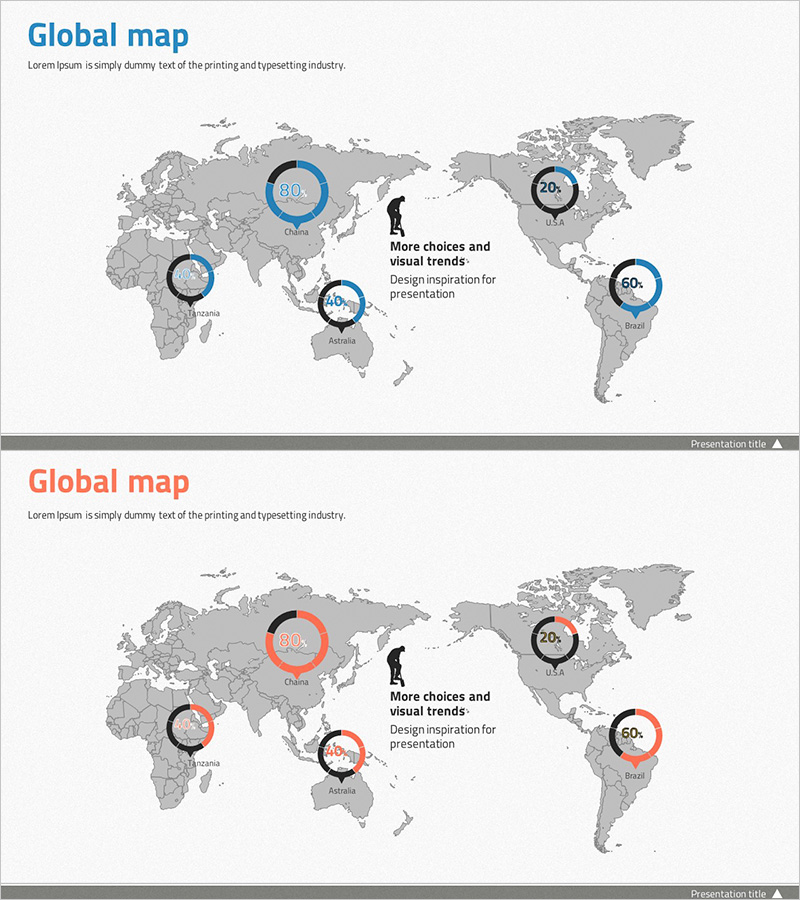
A world map-based PowerPoint slide designed for global target market analysis and regional performance comparison. The slide features a gray world map background with four key regions (Europe, North America, Australia, South America) highlighted using circular percentage charts. Two design variations are included: the first with blue accent colors and the second with orange accents, allowing flexible color customization. Each region displays percentage data visually, making it ideal for investor presentations, market entry strategies, and global business analysis reports. The slide is ready to use and fully editable for your specific market data.
Usage Points
-
Main Usage
Presents regional market distribution and performance metrics across the globe using an integrated map and data visualization approach. Enables executives and investors to quickly understand market penetration, regional growth rates, and geographic expansion opportunities through visual storytelling.
-
How to Use
Insert into investor pitch decks, business plans, or market analysis reports in the market overview section. Replace percentage values with your actual regional data and adjust colors to match corporate branding. The slide is fully editable and compatible with standard PowerPoint editing tools.
-
Recommended For
Ideal for startups and mid-size companies presenting global expansion strategies to investors, multinational corporations analyzing regional market performance, consulting firms proposing international business strategies, and marketing teams planning global campaign rollouts.
-
Slide Structure
Two-slide set with blue and orange color scheme variations. Each slide contains a world map background, four regional location markers, four circular percentage charts, and corresponding data labels. Ample space for text customization and legend placement ensures professional presentation quality.
Related Products
-

Global Network Analysis Chart – Visualizing Target Market Strategy
#Company Introduction #Marketing Plan and Strategy #Graph
-

Analysis of Global Market Growth Trends - Challenges for Business Opportunities
#Company Introduction #Marketing Plan and Strategy #Graph
-

Country-by-country Affiliate Status Analysis Graph – Global Network Strategy
#Company Introduction #Marketing Plan and Strategy #Graph
-

Target Market Entry Analysis Graph
#Company Introduction #Marketing Plan and Strategy #Graph
