Office Supplies Theme Area Graph – Market Analysis and Competitor Comparison
RJ0300063_8
- Last Update 05/05/2025
- File Size 5MB
- # of Slides 2
- File Format PPTX
- Slide Ratio 16:9
- Color
Keywords
- #Content-Based Slides
- #Design-Based Slides
- #Market and Competitor Analysis
- #Graph
- #Other
- #Competitor Analysis
- #Market Analysis
- #Other
- #Area Chart
- #Map
- #16:9
- #area chart PowerPoint
- #area graph slide template
- #trend comparison chart
- #market analysis PowerPoint
- #competitor analysis slide
- #data visualization template
About the Product
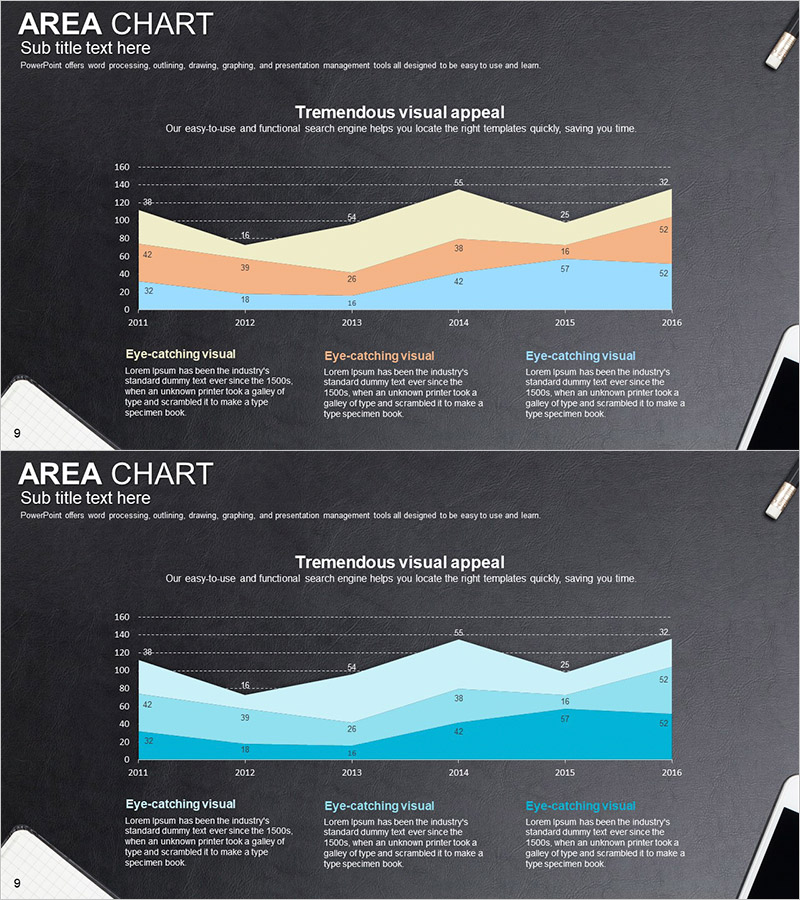
A professional area chart PowerPoint slide set featuring 2 slides optimized for market analysis and competitor comparison. The dark background design incorporates three color series—beige, orange, and blue—to visualize data trends from 2011 to 2016. Each slide includes an area chart with gridlines and data point markers for precise numerical comparison, plus three text boxes at the bottom for adding analysis insights. The office supplies theme provides a clean, minimal layout suitable for business presentations, marketing proposals, financial reports, and competitive analysis decks. Fully editable and ready to customize with your own data.
Usage Points
-
Main Usage
Area charts excel at displaying cumulative changes across multiple data series over time. This template is ideal for market size trends, competitor market share comparisons, revenue composition changes, and other stacked trend analyses. Color-coded areas make it easy to distinguish each series contribution at a glance.
-
How to Use
Input your actual data into the area chart at the top of each slide to visualize trends, then add analysis content, key insights, and conclusions in the three text boxes below. Gridlines and data point markers support accurate numerical comparison, while the color series clearly differentiate categories.
-
Recommended For
Marketing teams presenting market analysis, sales teams comparing competitors, finance teams reporting revenue composition, and executive presentations requiring trend analysis. Most effective when comparing 3–5 cumulative data series across a time axis.
-
Slide Structure
2-slide set. Each slide features an area chart (3 series, 6 data points from 2011–2016, with gridlines and markers) in the upper section, a title area in the middle, and three text input boxes at the bottom labeled 'Eye-catching visual' for flexible content placement.
Related Products
-

Competitor Analysis Graphs & Tables – Delivering Market Insights
#Market and Competitor Analysis #Diagram #Graph
-

Gradient Theme Area Diagram – Market and Competitor Analysis
#Market and Competitor Analysis #Diagram #Graph
-

Market Distribution Comparison Graph – Trends and Analysis
#Market and Competitor Analysis #Diagram #Graph
-

Competitive Analysis Area Diagram
#Market and Competitor Analysis #Graph #Competitor Analysis
