Downtrend Broken Line Graph – Market and Competitor Analysis
RJ0300072_27
- Last Update 05/08/2025
- File Size 1.3MB
- # of Slides 2
- File Format PPTX
- Slide Ratio 16:9
- Color
Keywords
About the Product
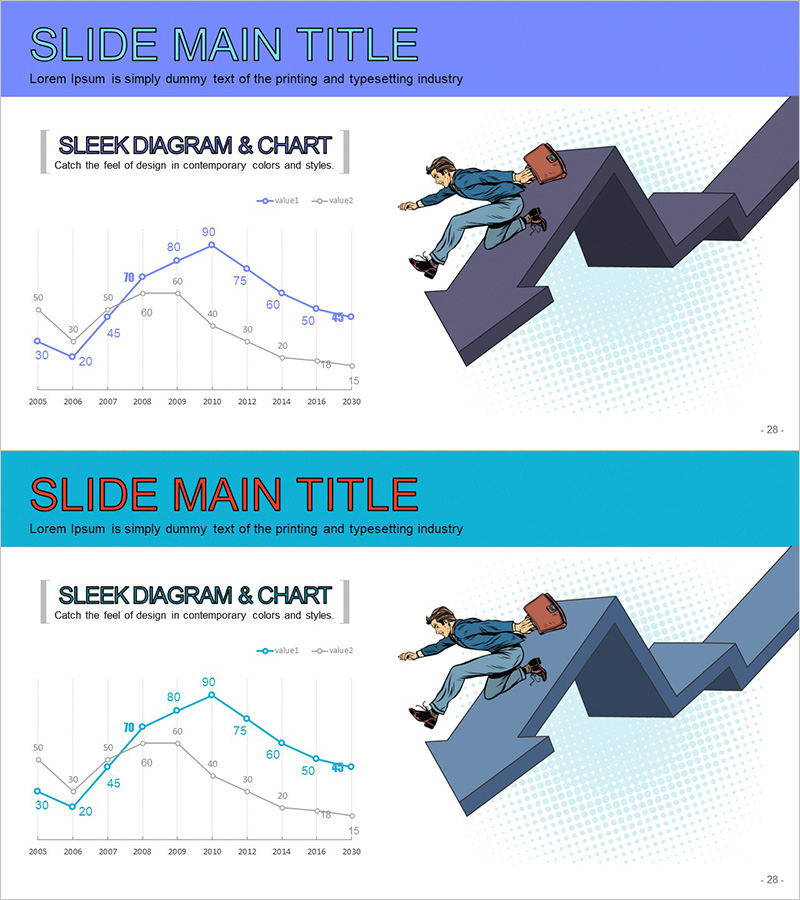
A dual-series line graph PowerPoint slide optimized for market analysis and competitor comparison presentations. This chart visualizes data trends from 2005 to 2030 using two distinct data series, making it ideal for competitive advantage analysis and market performance reporting. The blue and gray line design provides clear visual differentiation, with numerical labels displayed at every data point for precise value communication. Delivered in 16:9 widescreen format with 2 slides in editable PPTX format, ready for immediate customization and presentation use.
Usage Points
-
Main Usage
Visualize and compare market conditions against competitor performance simultaneously using a downtrend line chart. This slide supports strategic decision-making in market opportunity identification, competitive strategy development, and investor communications.
-
How to Use
Insert into IR decks, business plans, or market analysis reports within the market overview section. Replace the blue line with your company data and the gray line with competitor data to highlight comparative analysis. Update numerical labels with actual figures for immediate presentation readiness.
-
Recommended For
Executives, strategy managers, marketing teams, and investor relations professionals presenting market analysis findings. Particularly effective for competitive advantage analysis, market share trend reporting, and growth rate comparisons.
-
Slide Structure
Title area at top (SLIDE MAIN TITLE with descriptive text), dual-series line chart with legend in center, and business growth illustration on right side. Both slides feature identical layout for seamless comparative analysis across multiple data sets.
Related Products
-

Doughnut Chart Presentation for Pet Store Competitor Analysis
#Market and Competitor Analysis #Graph #Competitor Analysis
-

Carbon Neutral Competitive Advantage Horizontal Chart
#Market and Competitor Analysis #Graph #Competitor Analysis
-

Business Program Analysis Area Graph – Competitive Edge
#Market and Competitor Analysis #Diagram #Graph
-

Competitor 3D Broken Line Graph – Competitive Advantage Analysis
#Market and Competitor Analysis #Graph #Competitor Analysis
