Successful Sales and Profit Table
RJ0300072_26
- Last Update 05/08/2025
- File Size 0.5MB
- # of Slides 2
- File Format PPTX
- Slide Ratio 16:9
- Color
Keywords
About the Product
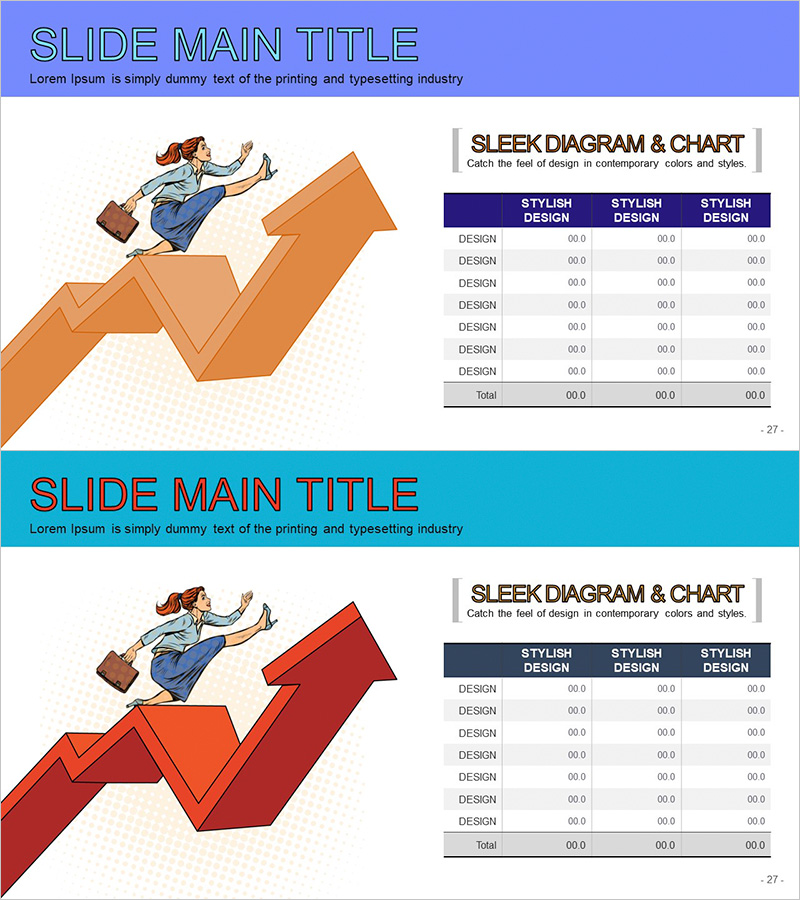
A financial data table PowerPoint slide that clearly visualizes sales and profit metrics. This slide features a 3-column data table paired with orange and red upward trend arrows, enabling at-a-glance comparison of financial performance. Ideal for financial reports, investor presentations, and business performance reviews, this PPT slide supports data-driven decision-making. Optimized for 16:9 widescreen format with fully editable table cells for seamless customization.
Usage Points
-
Main Usage
This slide presents financial performance data in a structured table format for clear communication. It enables simultaneous comparison of multiple financial indicators such as revenue, profit, and expenses, effectively demonstrating financial health to investors and executives.
-
How to Use
Use this slide in the financial overview section, performance analysis, quarterly or annual comparisons, and investor pitch decks. Customize the table rows and columns to input actual financial data, and adjust background colors and fonts to match your corporate branding.
-
Recommended For
CFOs, finance managers, executives, and investor relations professionals presenting financial performance. Suitable for business plans, investor pitches, quarterly earnings presentations, and financial reports requiring data-driven insights.
-
Slide Structure
The slide layout includes a title area at the top, an upward trend graph with orange and red arrows on the left, and a 3-column data table on the right (7 data rows plus total row). The table header features a dark blue background with white text, while data cells use gray backgrounds for enhanced readability.
Related Products
-

Income Statement Table – Clear Visualization of Financial Performance
#Financial Plans and Performance #Diagram #Income Statement
-

Affiliate Business Income Statement – Visualizing Financial Performance
#Financial Plans and Performance #Diagram #Income Statement
-

Sales and Profit Calculation Table – Key to Profit Management
#Financial Plans and Performance #Diagram #Income Statement
-

Sales and Bills Slide for Navigation App
#Financial Plans and Performance #Diagram #Income Statement
