Key Performance Table Diagram for Visualizing Business Goals – Performance-Based Strategy
RM0200008_7
- Last Update 02/03/2025
- File Size 1MB
- # of Slides 2
- File Format PPTX
- Slide Ratio 16:9
- Color
Keywords
- #Content-Based Slides
- #Design-Based Slides
- #Company Introduction
- #Business Vision and Strategy
- #Diagram
- #Key Achievements
- #Business Goals
- #Cluster
- #Table
- #Closed Cluster Diagram
- #Standard Table
- #16:9
- #KPI performance table PowerPoint
- #business metrics diagram
- #performance dashboard slide
- #goal tracking template
- #balanced scorecard PPT
About the Product
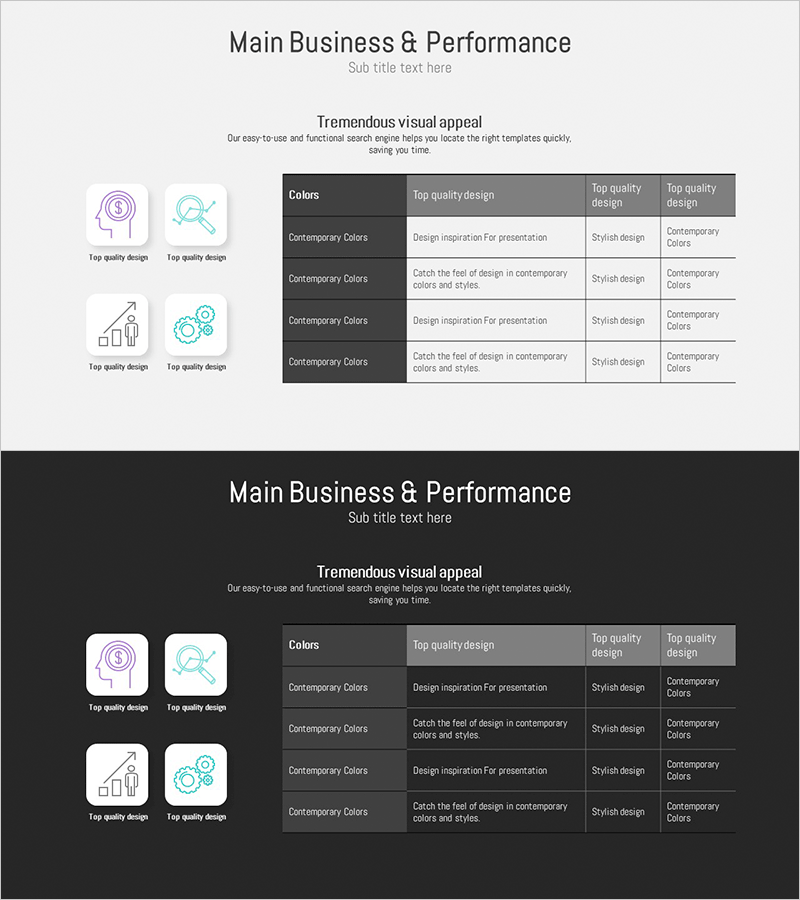
A performance metrics table PowerPoint slide designed to track business goal achievement and key performance indicators (KPIs) visually. The slide features a 4-row by 5-column data table structure that enables side-by-side comparison of KPI names, targets, achievement rates, and evaluations. Light gray header cells and white data cells create clear visual contrast for optimal readability. Four icons (finance, search, chart, and gear) positioned on the left symbolize core performance management dimensions. This presentation slide is ready to use in executive reports, quarterly performance reviews, and strategic execution dashboards.
Usage Points
-
Main Usage
Track and compare business goal achievement and key performance indicators (KPIs) systematically using a structured performance management table. Supports balanced evaluation across financial, operational, customer, and learning perspectives. Ideal for executive reports, quarterly performance reviews, and strategic execution presentations.
-
How to Use
Enter KPI names, target values, current achievement rates, and evaluations into each table cell to display performance status at a glance. The four icons on the left represent core performance dimensions (finance, process, customer, organization), which can be customized with text to match your presentation context.
-
Recommended For
CFOs, executives, business managers, strategy planning teams, and performance management departments conducting quarterly or annual performance evaluations, goal achievement reporting, and management dashboard development. Particularly effective for presentations applying balanced scorecard concepts.
-
Slide Structure
2-slide set. Title area at top, central 4-row 5-column data table (header: KPI, Target, Achievement, Evaluation, Remarks / 4 data rows), and 4 icons on left (finance, search, chart, gear). Light gray headers and white data cells establish clear information hierarchy.
Related Products
-

Setting Project Goals Slide - Strengthening Business Strategy
#Business Vision and Strategy #Marketing Plan and Strategy #Diagram
-

How to Enjoy Nature – Vision and Strategy
#Business Vision and Strategy #Technical Approach #Diagram
-

Introducing the Securities Service Program – Innovation and Goal Achievement
#Product/Service Introduction #Business Vision and Strategy #Diagram
-

Bank Securities Service Procedures Slide – Product and Service Introduction
#Product/Service Introduction #Business Vision and Strategy #Diagram
