Competitor Growth Comparison Radial Chart
RM0400012_10
- Last Update 02/18/2025
- File Size 1MB
- # of Slides 2
- File Format PPTX
- Slide Ratio 16:9
- Color
Keywords
- #Content-Based Slides
- #Design-Based Slides
- #Market and Competitor Analysis
- #Graph
- #Competitor Analysis
- #Market Analysis
- #Other
- #Radar Chart Spider Chart
- #16:9
- #radial chart PowerPoint
- #competitor analysis presentation
- #6-axis data visualization
- #growth comparison slide
- #radial graph template
- #market analysis PowerPoint
About the Product
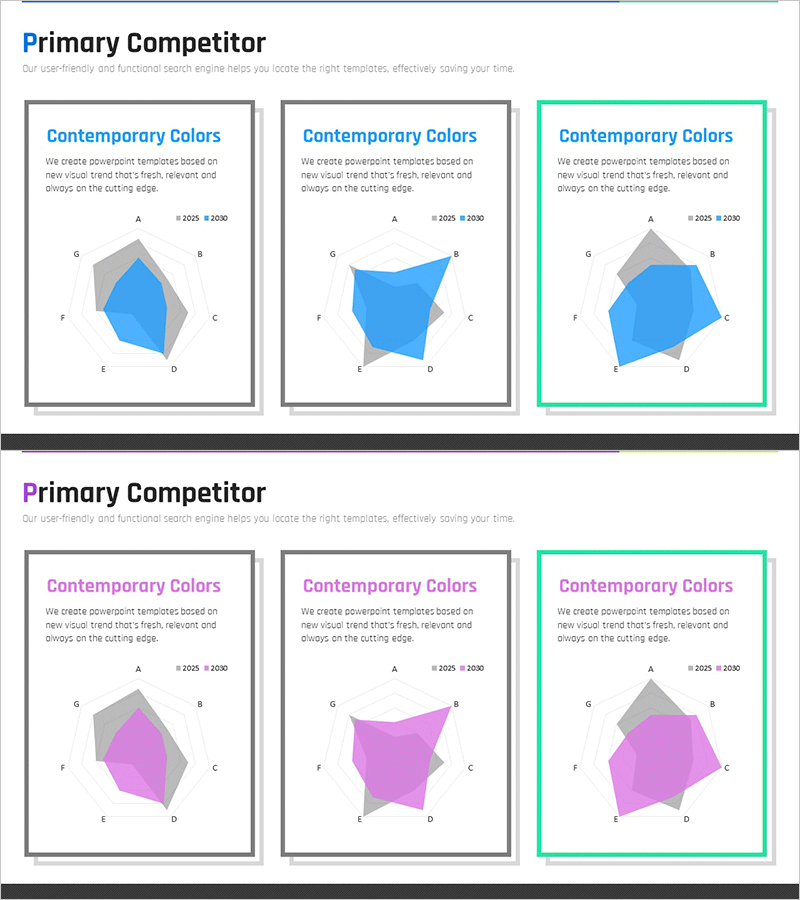
A PowerPoint slide featuring a 6-axis radial chart for comparing competitor growth metrics at a glance. Data for 2025 and 2030 are distinguished by gray and blue colors, clearly showing trends over time. Each axis (A–G) can represent various performance indicators such as revenue, market share, customer satisfaction, technology capability, brand value, innovation, and global expansion. Ready to use in presentation decks and reports for competitive analysis sections, with fully editable colors and data values for customization.
Usage Points
-
Main Usage
Visually compare performance metrics across multiple dimensions between competitors and your organization, clearly highlighting strengths and weaknesses. The 6-axis design enables simultaneous representation of complex indicators including revenue, market share, customer satisfaction, technology capability, brand value, and innovation.
-
How to Use
Deploy in executive reports, investor presentations, and strategic planning meetings during competitive analysis sections. Compare 2025 (gray) and 2030 (blue) data to demonstrate future growth direction. Customize axis labels and values with your own data for immediate use in presentations.
-
Recommended For
Strategic planning teams, marketing professionals, executives, investor relations (IR) specialists, and consulting firms preparing competitive analysis materials. Particularly effective when compressing multiple performance indicators into a single slide for comprehensive comparison.
-
Slide Structure
Two-slide set, each centered on a 6-axis radial chart. The first slide emphasizes the blue data area, while the second overlays gray and blue for enhanced comparison effect. Axis labels (A–G) are positioned at each endpoint, with a legend distinguishing 2025 and 2030 data series.
Related Products
-

Brain Data Analysis Radial Graph – Insights on Technology and Market
#Market and Competitor Analysis #Diagram #Graph
-

Competitor Analysis Pentagon Radial Graph – Concept and Strategy
#Market and Competitor Analysis #Graph #Competitor Analysis
-

Geometry PPT Template Wide Radar Chart – Market and Competitor Analysis
#Market and Competitor Analysis #Graph #Competitor Analysis
-

Service Analysis Radial Graph – Market and Competitor Analysis
#Market and Competitor Analysis #Diagram #Graph
