Competitor 3D Broken Line Graph – Competitive Advantage Analysis
RJ0300067_26
- Last Update 05/07/2025
- File Size 1MB
- # of Slides 2
- File Format PPTX
- Slide Ratio 16:9
- Color
Keywords
- #Content-Based Slides
- #Design-Based Slides
- #Market and Competitor Analysis
- #Graph
- #Competitor Analysis
- #Competitive Advantage
- #Line
- #Line Chart
- #16:9
- #line chart PowerPoint
- #3-series line graph
- #market analysis slide
- #competitive analysis template
- #trend visualization
- #how to create line chart in PowerPoint
About the Product
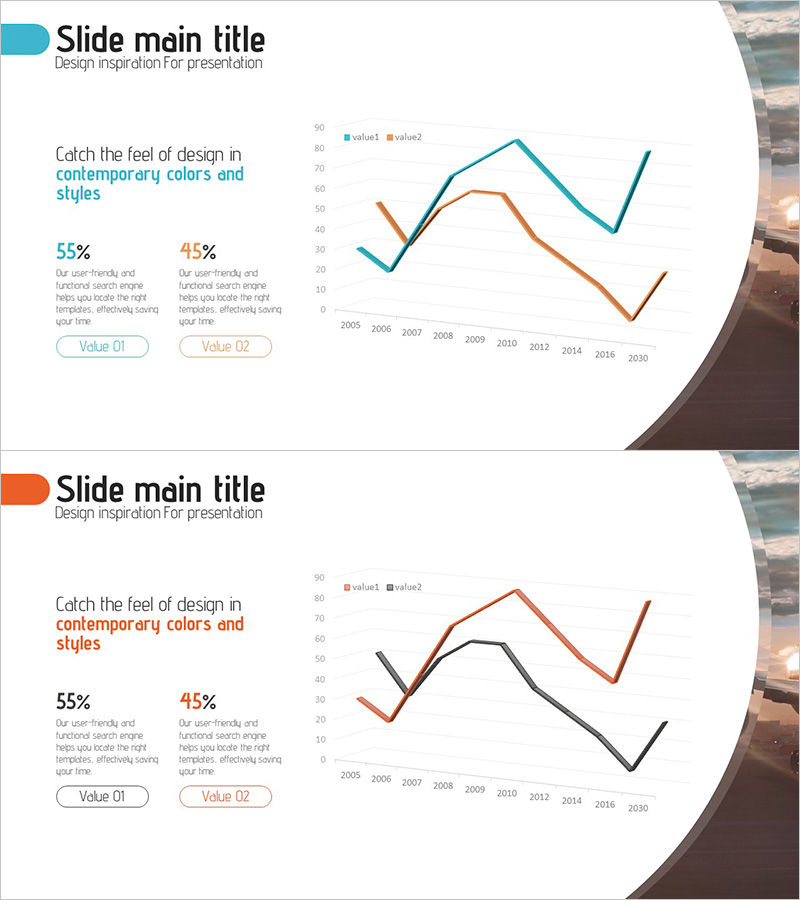
A professional 3-series line chart PowerPoint slide designed for competitive analysis and market trend visualization. The slide features three distinct data series in teal, orange, and brown colors, tracking changes from 2005 to 2030 across 25 years. Each line represents independent performance metrics with clear intersection points and trend reversals. Ideal for business presentations, strategic reports, and competitive positioning documents. Instantly editable and ready to integrate into executive briefings, market analysis decks, and investor pitch presentations.
Usage Points
-
Main Usage
Enables simultaneous comparison of three competitive metrics, market share evolution, and industry trend trajectories across a 25-year timeline. Clearly displays growth patterns, decline phases, and inflection points, making it essential for executive reports, strategic planning sessions, and investor presentations where competitive positioning must be visually demonstrated.
-
How to Use
Replace legend labels (value1, value2, value3) with your company, competitor, and market benchmark names. Input year-by-year data points and the chart automatically updates. Colors, line thickness, and legend placement are fully customizable to match corporate branding guidelines. Both slides share identical structure, allowing parallel comparison of multiple metrics.
-
Recommended For
Ideal for C-suite executives, strategy teams, marketing departments, and sales teams presenting competitive analysis reports, quarterly performance reviews, and market entry strategies. Particularly valuable for B2B companies in investor relations, consulting firms delivering market research, and financial institutions publishing industry reports requiring credible data visualization.
-
Slide Structure
Two identical slides featuring: title area + 3-series line chart (X-axis: 2005-2030, Y-axis: 0-90) + legend (value1, value2, value3) + left-side text block with 55% and 45% metrics. Right-side background image enhances visual impact. Optimized for 16:9 widescreen format with professional layout balance.
Related Products
-

Default Line Graph for Market & Competitor Analysis – Competitive Advantage
#Market and Competitor Analysis #Graph #Competitor Analysis
-

Competitor Comparison Analysis Graph - Highlighting Competitive Advantage
#Market and Competitor Analysis #Graph #Competitor Analysis
-

Korea China Japan Analysis Graph – Market Competitive Advantage
#Market and Competitor Analysis #Graph #Other
-

Blue Green Broken Line Graph – Competitor Analysis
#Market and Competitor Analysis #Graph #Competitor Analysis
