Household Survey by Region Slide – Visualizing Market Analysis Template
RJ0900002_17
- Last Update 08/16/2025
- File Size 0.2MB
- # of Slides 2
- File Format PPTX
- Slide Ratio 16:9
- Color
Keywords
About the Product
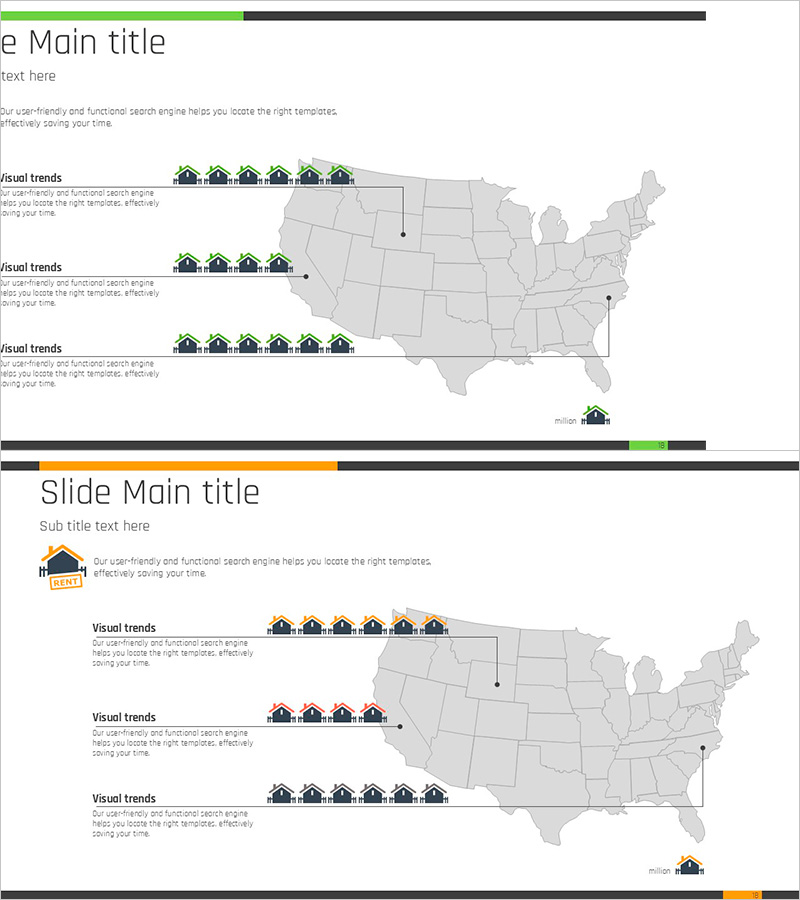
A PowerPoint slide that visualizes household survey data across US regions using an interactive map layout. The template features a gray background map with green icons representing regional statistics, enabling quick identification of market conditions by geography. The 2-slide set includes a title slide and a detailed map analysis slide, ready for immediate use in target market analysis, market share comparison, and regional consumption trend presentations. Delivered in 16:9 widescreen PPTX format, fully editable in all presentation software.
Usage Points
-
Main Usage
Visualize regional market conditions, consumption trends, and household survey statistics through geographic mapping to support data-driven decision-making. Enhances credibility in marketing, market research, and business planning presentations requiring regional comparison analysis.
-
How to Use
Enter your presentation topic in the title slide fields. Add regional statistics and analysis details to the map slide text areas. Adjust green icon positions and quantities to reflect actual data, and customize colors to match your presentation theme.
-
Recommended For
Marketing strategists, market research analysts, business development teams, and regional sales managers presenting target market analysis, regional consumption data, and household statistics. Ideal for investment pitch decks, business plans, and market analysis report sections.
-
Slide Structure
2-slide layout: Title slide with main and subtitle text fields (2 input areas) + Map analysis slide featuring US geographic background, 6-7 green data icons, and 3 text input areas on the left. Each regional data point is independently editable and customizable.
Related Products
-

Target Country Analysis Bar Graph Map – Providing Market Insights
#Market and Competitor Analysis #Graph #Other
-

Gauge Charts by Region – Market Analysis and Competitiveness
#Market and Competitor Analysis #Graph #Other
-

Scientific and Technological Development Countries Map – Market Analysis and Competitor Insights
#Market and Competitor Analysis #Other #Market Analysis
-

Asian Target Market Analysis Graph
#Market and Competitor Analysis #Graph #Other
