Target Market Year-to-Year Comparison Analysis – Visualizing Market Trends
RJ0400051_7
- Last Update 05/31/2025
- File Size 5.1MB
- # of Slides 2
- File Format PPTX
- Slide Ratio 16:9
- Color
Keywords
- #Content-Based Slides
- #Design-Based Slides
- #Market and Competitor Analysis
- #Graph
- #Other
- #Market Analysis
- #Target Market
- #Column
- #Segmented Column
- #Map
- #16:9
- #world map PowerPoint slide
- #market analysis presentation
- #regional data visualization
- #year-over-year comparison chart
- #global market template
- #map chart download
About the Product
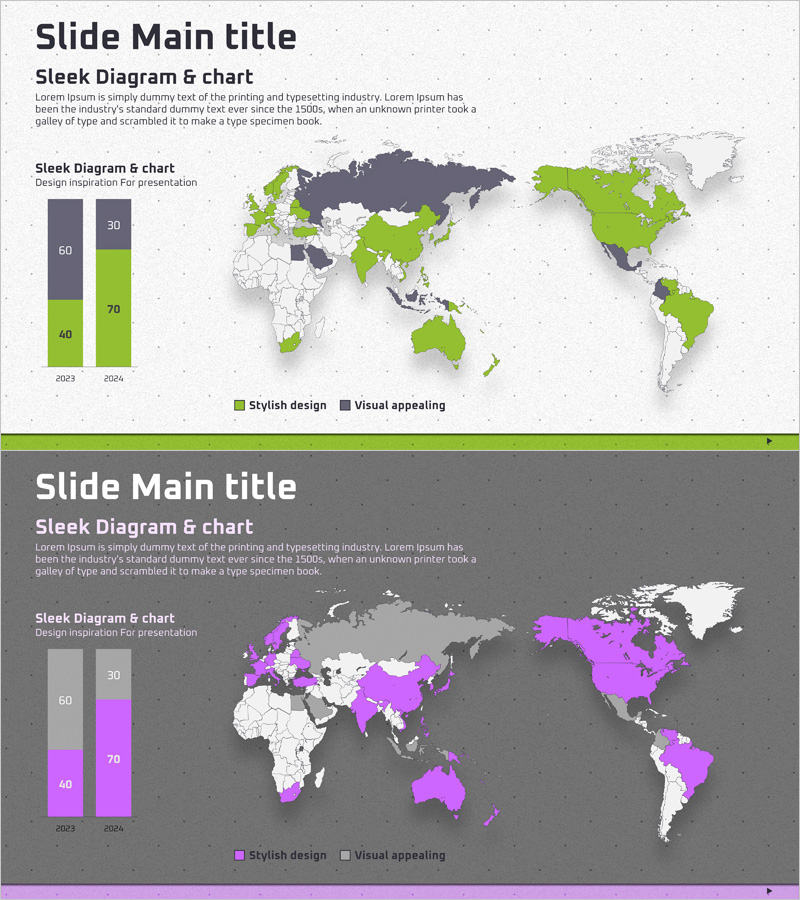
A world map-based PowerPoint slide for visualizing global market trends and regional performance. This presentation template combines a vertical bar chart on the left with a world map on the right, using lime green and dark gray tones to highlight regional market data and year-over-year growth rates. The 2-slide set includes both light and dark background versions, allowing you to match your presentation style. Ideal for business expansion strategies, investment pitch decks, and market analysis reports where you need to communicate international market data and regional target markets effectively.
Usage Points
-
Main Usage
This slide enables simultaneous analysis and visualization of global market trends and regional target markets. By connecting color-highlighted regions on the world map with year-over-year data in the bar chart, it effectively communicates international market expansion strategies, regional sales performance, and global business results to stakeholders.
-
How to Use
Use this slide in the market analysis section of investment pitch decks, business plans, and marketing strategy reports. Input year-over-year growth rates or regional revenue figures into the left bar chart, and modify the color-highlighted regions on the world map to reflect your target markets. Choose between light and dark background versions to match your presentation design theme.
-
Recommended For
Executives, strategy teams, marketing departments, and sales teams presenting global market performance. Particularly effective for multinational corporations reporting regional business results, new market entry plans, and international investment pitches where simultaneous visualization of regional data and growth trends is essential.
-
Slide Structure
2-slide set with Slide 1 featuring a light background (lime green and dark gray) and Slide 2 with a dark background (magenta and light gray). Each slide contains a vertical bar chart on the left (2 years, 3 data points per series) and a world map on the right with color-highlighted regions. Includes legend and title areas for customization.
Related Products
-

Global Target Market Bar Graph – Stylish and Visually Appealing
#Company Introduction #Market and Competitor Analysis #Graph
-

Science and Technology Observation Target Market – Market Analysis Slide
#Market and Competitor Analysis #Other #Market Analysis
-

Asian Target Market Analysis Graph
#Market and Competitor Analysis #Graph #Other
-

Regional Analysis Graphs – Visualizing Market Trends
#Market and Competitor Analysis #Graph #Other
