Airplane Bar Graph – Market Competition Analysis
RJ0300067_15
- Last Update 05/07/2025
- File Size 1MB
- # of Slides 2
- File Format PPTX
- Slide Ratio 16:9
- Color
Keywords
About the Product
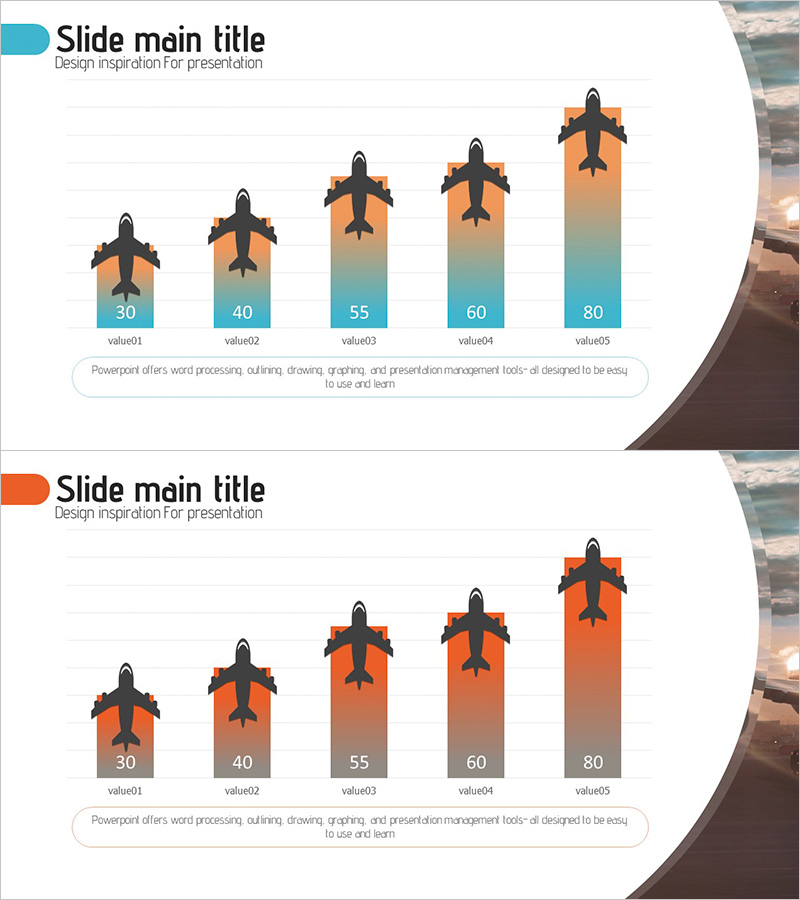
A PowerPoint slide combining airplane silhouette icons with gradient vertical bar charts. Five bars display numerical data (30, 40, 55, 60, 80) with a gradient background transitioning from orange to blue, visualizing growth progression at each stage. Ideal for business presentations including market competition analysis, sales performance comparison, and performance metrics tracking. Provided as 2 slides in editable PPTX format for immediate use in reports and pitch decks.
Usage Points
-
Main Usage
Compares and analyzes five data points while visualizing growth progression. The airplane icon symbolizes global expansion, market entry, and upward trajectory, while the gradient color scheme intuitively communicates stage-by-stage advancement and performance improvement.
-
How to Use
Apply to market competition analysis, sales performance comparison, performance metrics trends, customer satisfaction changes, and market share fluctuations. Edit each bar's values and labels with your own data for immediate presentation use.
-
Recommended For
Marketing managers, sales directors, executives preparing reports, business analysts, and consultants presenting data-driven insights. Particularly effective for presentations emphasizing growth trends or competitive positioning.
-
Slide Structure
2-slide set. Each slide features 5 vertical bars (heights 30–80) with airplane icons, orange-to-blue gradient background, and descriptive text area at bottom. 16:9 widescreen format in editable PPTX with all elements customizable.
Related Products
-

Vertical Bar Standard Color Chart for Market Analysis – Market and Competitor Analysis
#Market and Competitor Analysis #Graph #Competitor Analysis
-

Comparative Analysis Vertical Bar Graph for Market Insights
#Market and Competitor Analysis #Graph #Other
-

Vertical Bar Graph for Market and Competitor Analysis – Professional Data Visuals
#Market and Competitor Analysis #Graph #Competitor Analysis
-

Business Market Analysis Bar Graph – Visualizing Competitive Analysis
#Market and Competitor Analysis #Diagram #Graph
