Market Analysis Circular Bar Graph – Clarity in Information Delivery
RJ0400067_6
- Last Update 06/05/2025
- File Size 0.1MB
- # of Slides 2
- File Format PPTX
- Slide Ratio 16:9
- Color
Keywords
About the Product
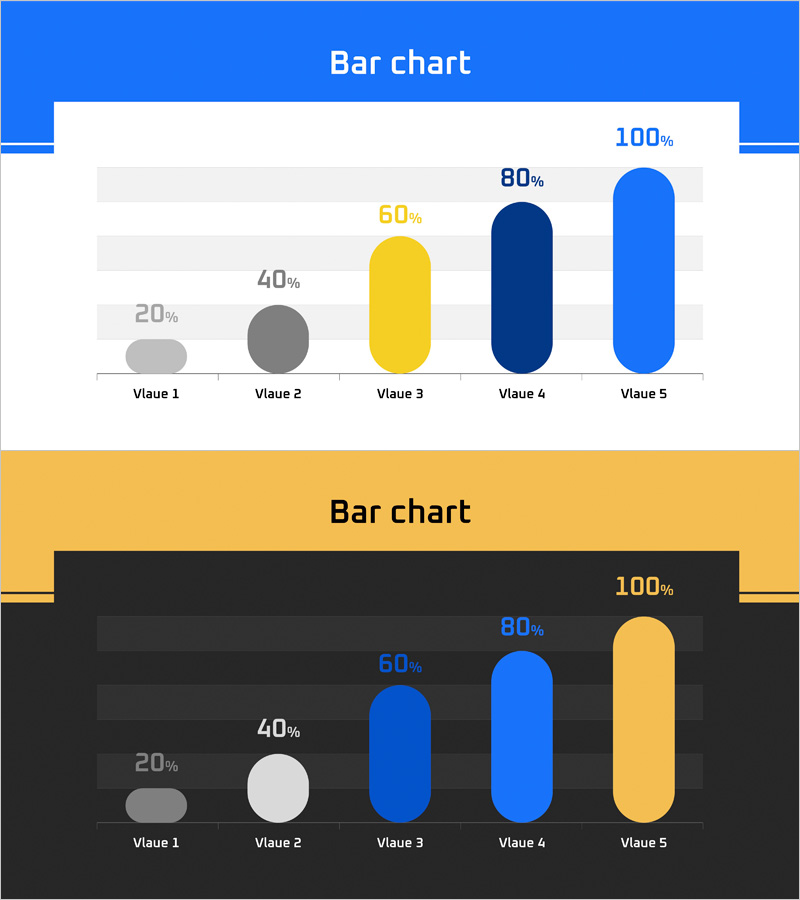
A vertical circular bar chart PowerPoint slide designed for market analysis and competitive comparison presentations. This slide template displays five data items ranging from 20% to 100% using four distinct colors: gray, yellow, dark blue, and bright blue. The rounded bar format enables intuitive numerical comparison, while background grid lines enhance readability and information clarity. Two design variations are included—one with a light background and one with a dark background—allowing you to select the version that best suits your presentation environment. Fully editable PPTX format for immediate customization.
Usage Points
-
Main Usage
Visualize numerical data for market analysis, competitive benchmarking, performance comparison, and capability assessment across five categories. The circular bar format clearly shows relative magnitude of each item, while percentage labels simultaneously communicate ratio information.
-
How to Use
Replace the sample percentages (20%, 40%, 60%, 80%, 100%) with your actual data values and update item labels (Value 1–5) to match your analysis categories. Colors can remain consistent with the template or be adjusted to match your corporate brand palette. Use the light background slide for standard presentations and the dark background version for dimly lit conference rooms.
-
Recommended For
Marketing managers, strategy planners, sales executives, management consultants, and financial analysts preparing market reports, competitive analysis, performance reviews, and strategic presentations. Ideal for business plans, quarterly reports, investor presentations, and strategy meeting materials.
-
Slide Structure
Two-slide layout, each containing a five-item vertical circular bar chart. The first slide features a light blue background with gray, yellow, dark blue, and bright blue bars arranged vertically. The second slide presents the same data structure on a dark background. Percentage values appear above each bar, with item labels positioned at the bottom of the chart.
Related Products
-

Pie & Bar Analysis Graphs – Optimized for Market and Competitor Analysis
#Market and Competitor Analysis #Graph #Competitor Analysis
-

Comparative Analysis Bar Graph & Table – Optimized for Market and Competitor Analysis
#Market and Competitor Analysis #Diagram #Graph
-

Business Market Analysis Bar Graph – Visualizing Competitive Analysis
#Market and Competitor Analysis #Diagram #Graph
-

Vertical Bar Graph for Market and Competitor Analysis – Professional Data Visuals
#Market and Competitor Analysis #Graph #Competitor Analysis
