Brown Green Area Chart – Data Trend Analysis
RJ0600001_9
- Last Update 06/21/2025
- File Size 0.1MB
- # of Slides 2
- File Format PPTX
- Slide Ratio 16:9
- Color
Keywords
About the Product
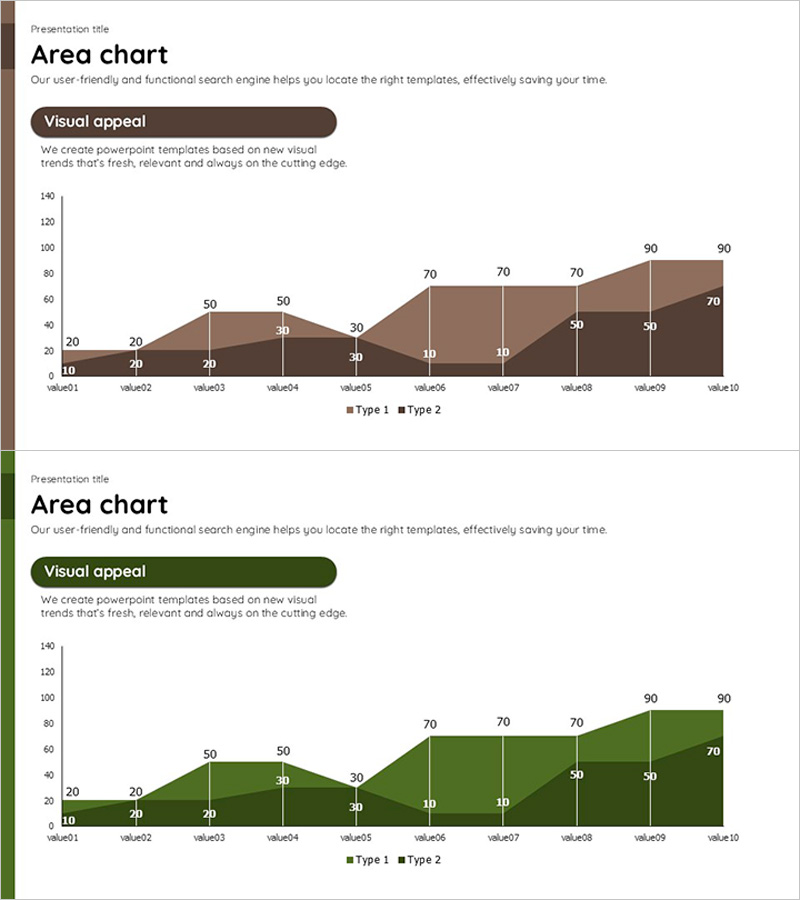
An area chart PowerPoint slide designed for market trend analysis and competitive benchmarking. This presentation template uses brown and green color schemes to distinguish Type 1 and Type 2 data series, visualizing numerical changes across 10 data points through stacked area representation. Ideal for conveying data trends intuitively and supporting future forecasts in business presentations. The slide set includes 2 slides optimized for 16:9 widescreen format. Text input areas and chart zones are clearly separated for immediate use and customization.
Usage Points
-
Main Usage
Visualize time-series data with two data series for market trends, competitive analysis, and future forecasting. Stacked area charts simultaneously show overall magnitude changes and individual series proportions, strengthening decision-making evidence.
-
How to Use
Input actual data into the chart area and it automatically updates the visualization. Brown and green colors can be customized to match corporate branding. Modify legend labels and axis titles to align with your presentation context.
-
Recommended For
Recommended for executives, analysts, and marketing professionals presenting business reports, investor relations meetings, marketing strategy presentations, and market analysis documents requiring data-driven insights.
-
Slide Structure
Two-slide set with each slide featuring a title area (top), descriptive text zone (left), and area chart (right). The chart displays 10 data points across 2 series with clearly labeled numerical values and dual-color stacking.
Related Products
-

Graphs that draw a successful future outlook – Visualizing Market Trends
#Market and Competitor Analysis #Graph #Other
-

Business Cartoon Theme Future Prospects – Visualizing Market Trends
#Market and Competitor Analysis #Diagram #Graph
-

Cartoon Theme Area Type Future Outlook Graph
#Market and Competitor Analysis #Graph #Other
-

Camera and Line Chart Comparison - Market Trends and Future Outlook
#Market and Competitor Analysis #Graph #Other
