Gender Analysis Graph – Stylish Slide for Customer Analysis
RM0200008_16
- Last Update 02/03/2025
- File Size 1.1MB
- # of Slides 2
- File Format PPTX
- Slide Ratio 16:9
- Color
Keywords
- #Content-Based Slides
- #Design-Based Slides
- #Market and Competitor Analysis
- #Marketing Plan and Strategy
- #Graph
- #Other
- #Customer Analysis
- #Target Setting
- #Column
- #Grouped Column
- #16:9
- #grouped bar chart PowerPoint
- #gender analysis slide template
- #customer demographic data visualization
- #horizontal vertical bar comparison
- #population statistics PPT
- #marketing report presentation
About the Product
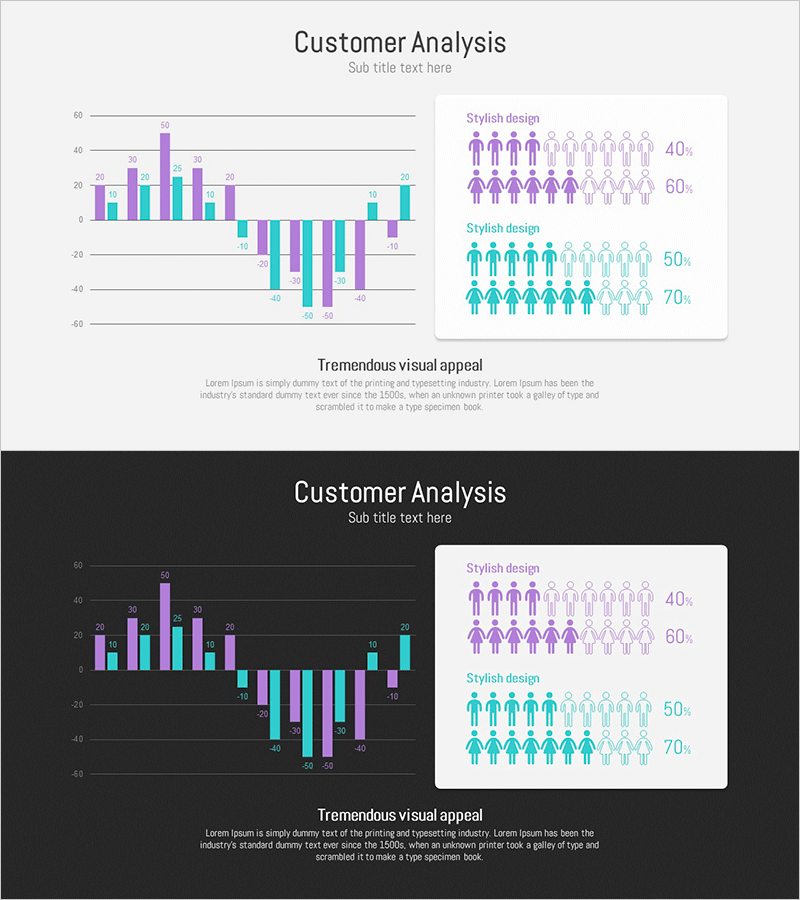
A PowerPoint slide template for customer analysis featuring gender ratio data visualization. This presentation includes two distinct layouts: horizontal and vertical grouped bar charts displaying identical data from different perspectives. The contrasting purple and teal color scheme makes male-female ratio comparisons intuitive, while demographic icons emphasize population statistics. Immediately applicable to marketing reports, customer analysis presentations, and market research materials.
Usage Points
-
Main Usage
Clearly compare and present gender ratios in customer demographic analysis through data visualization. Supports evidence-based decision-making in marketing strategy development, target audience analysis, and market research result presentations.
-
How to Use
Slide 1 displays horizontal grouped bars for side-by-side gender ratio comparison across multiple categories. Slide 2 presents the same data in vertical bar format to emphasize trends or categorical changes. Double-click chart values to replace with your actual data for immediate presentation use.
-
Recommended For
Marketing team customer analysis reports, sales strategy presentations, market research findings, HR department workforce composition analysis, and executive quarterly performance briefings. Suitable for any business presentation requiring data-driven decision support.
-
Slide Structure
2-slide set. Slide 1: Horizontal grouped bar chart with 5 categories × 2 series (male/female), purple-teal contrast colors, demographic icons infographic (4 rows) positioned right. Slide 2: Same data restructured as vertical bars, 2-column layout with chart left and infographic right.
Related Products
-

Rhombus Presentation Template Arrow Diagram – Effective Customer Analysis Tool
#Market and Competitor Analysis #Marketing Plan and Strategy #Text Box
-

PC Mockup and Target Settings – Market Analysis & Strategy
#Market and Competitor Analysis #Marketing Plan and Strategy #Other
-

Bundled Vertical Bar Graph Blue Green – Market and Customer Analysis
#Market and Competitor Analysis #Financial Plans and Performance #Graph
-

Male and Female Analysis by Country – Insights on Gender Ratio and Market Trends
#Market and Competitor Analysis #Marketing Plan and Strategy #Diagram
