Business Bi-level Bar Graph – Optimized for Competitor Analysis
RJ0300048_8
- Last Update 05/01/2025
- File Size 6.2MB
- # of Slides 2
- File Format PPTX
- Slide Ratio 16:9
- Color
Keywords
- #Content-Based Slides
- #Design-Based Slides
- #Market and Competitor Analysis
- #Graph
- #Competitor Analysis
- #Competitive Advantage
- #Horizontal Bar
- #Double Horizontal Bar
- #16:9
- #bi-level bar chart PowerPoint
- #competitor analysis slide template
- #horizontal bar graph presentation
- #data comparison chart
- #business benchmark PowerPoint slide
About the Product
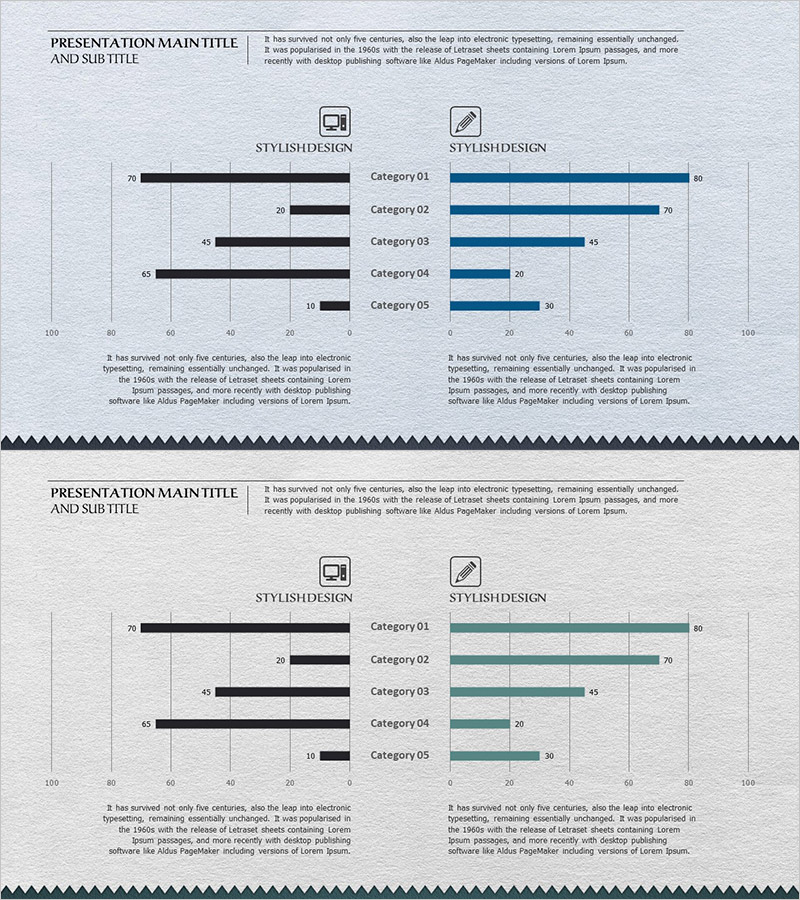
A dual-axis bar chart PowerPoint template optimized for competitor analysis and comparative data visualization. This slide features black bars on the left and blue bars on the right, enabling simultaneous comparison of two data series across five categories. The horizontal layout ensures category labels remain fully visible and readable, while gridlines and numerical labels support accurate data interpretation. Ideal for business presentations, marketing analysis reports, strategic planning documents, and competitive benchmarking slides that require clear side-by-side performance comparison.
Usage Points
-
Main Usage
Specialized for comparing two data series side by side across multiple categories. Ideal for competitive benchmarking, product performance comparison, market share analysis, departmental performance review, and any business scenario requiring direct numerical comparison between two entities or metrics.
-
How to Use
Enter numerical values for each category in both the left (black) and right (blue) bars. Bar lengths adjust automatically based on input values. Gridlines and axis labels ensure precise data reading. Colors can be customized to match your brand identity or presentation theme.
-
Recommended For
Marketing teams conducting competitor analysis reports, sales teams presenting performance comparisons, executive dashboards, strategic planning meetings, investor presentations, and quarterly business reviews. Suitable for all organizational levels requiring quantitative comparative analysis.
-
Slide Structure
Two-slide set featuring five categories (Category 01–05) each with dual horizontal bars representing two data series. Horizontal axis ranges from 0–100 with gridlines, category labels, and numerical values displayed. 16:9 widescreen format optimized for modern presentation environments and digital displays.
Related Products
-

Competitor Analysis Bilinear Bar Graph – Identify Market Advantage
#Market and Competitor Analysis #Graph #Competitor Analysis
-

Competitive Advantage 3D Bi-directional Bar Graph – Essential Tool for Market Analysis
#Market and Competitor Analysis #Graph #Competitor Analysis
-

Comparative Analysis of Sales of Camping Competitors – Insights and Comparisons
#Market and Competitor Analysis #Graph #Competitor Analysis
-

Competitor Analysis and Competitive Advantage Visualization – Harmony of Green and Orange
#Market and Competitor Analysis #Diagram #Graph
