Technology Status Analysis Graph – Realistic Vision and Strategy
RJ0300055_15
- Last Update 05/03/2025
- File Size 3.1MB
- # of Slides 2
- File Format PPTX
- Slide Ratio 16:9
- Color
Keywords
- #Content-Based Slides
- #Design-Based Slides
- #Business Introduction
- #Market and Competitor Analysis
- #Graph
- #Technological Status
- #Market Analysis
- #Other
- #Other Charts
- #16:9
- #technology status analysis graph
- #horizontal bar chart PowerPoint
- #market analysis presentation slide
- #competitive analysis chart
- #technology benchmarking PowerPoint template
About the Product
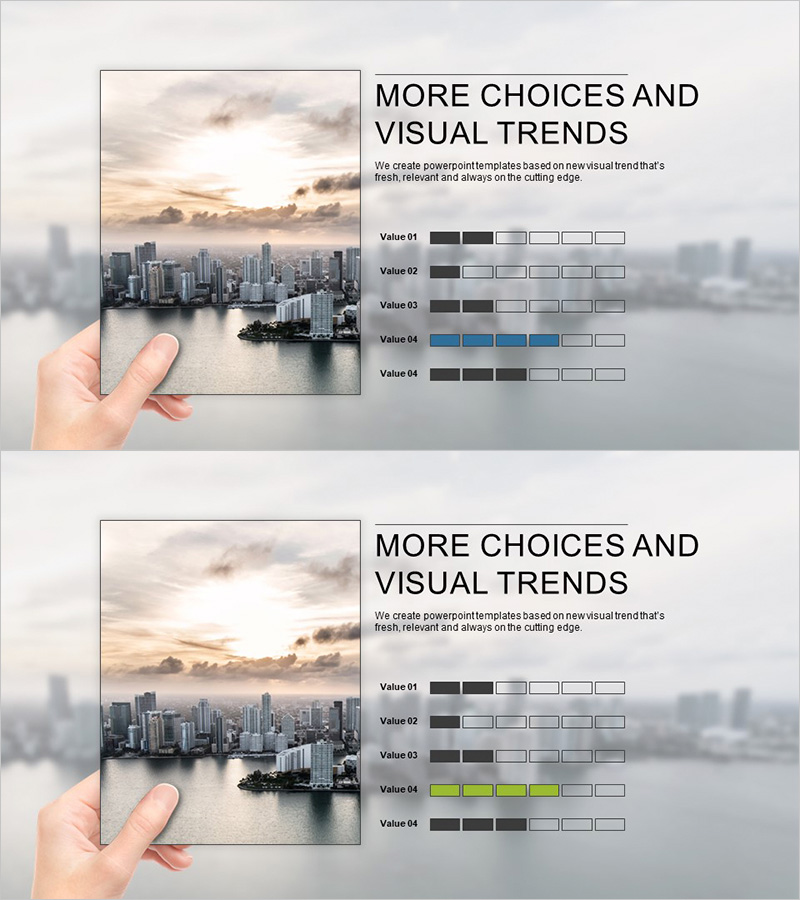
A horizontal bar chart PowerPoint slide that visualizes technology status and market trends with five comparable items. The slide uses black, gray, and light gray tones in segmented bars to represent progress levels, making it ideal for competitive analysis, technology benchmarking, and market share assessment. The realistic cityscape background paired with a tablet mockup held in hand enhances presentation credibility. The 2-slide set accommodates various data scenarios and is delivered in 16:9 widescreen PPTX format for immediate editing and deployment.
Usage Points
-
Main Usage
This slide clearly compares and analyzes technology status, market trends, and competitive positioning using a horizontal bar chart format. Five items are displayed with color-coded progress bars, enabling audiences to instantly grasp data differences and relative performance levels.
-
How to Use
Use this slide in technology strategy presentations, market analysis reports, competitive landscape reviews, and product development progress updates. Simply modify bar lengths and colors to reflect your actual data, then customize the title and legend to match your presentation context.
-
Recommended For
Technology officers, product managers, marketing strategists, executive report presenters, and market analysts who need to communicate technology status and market dynamics persuasively. Particularly effective in strategic planning meetings and investor pitch decks requiring quantitative comparisons.
-
Slide Structure
The 2-slide set features horizontal bar charts with five data items each. Bars are color-coded in black, gray, and light gray across 3–5 segments to represent progress or numerical values. Title area and data legend are clearly positioned for readability. The 16:9 widescreen format is optimized for contemporary presentation environments.
Related Products
-

Online Shopping Mall System Radial Graph – Dynamic Data Visualization
#Business Introduction #Market and Competitor Analysis #Graph
-

Business Sector Analysis Chart – Multifaceted Visualization
#Business Introduction #Market and Competitor Analysis #Diagram
-

Business Idea Development Analysis Circle Graph
#Business Introduction #Market and Competitor Analysis #Diagram
-

Analysis Graph by Car Type – Insights with Doughnut Chart
#Business Introduction #Market and Competitor Analysis #Graph
