Business Profitability Analysis Graph - Data-Driven Success Strategy
RJ0300054_8
- Last Update 05/02/2025
- File Size 3MB
- # of Slides 2
- File Format PPTX
- Slide Ratio 16:9
- Color
Keywords
About the Product
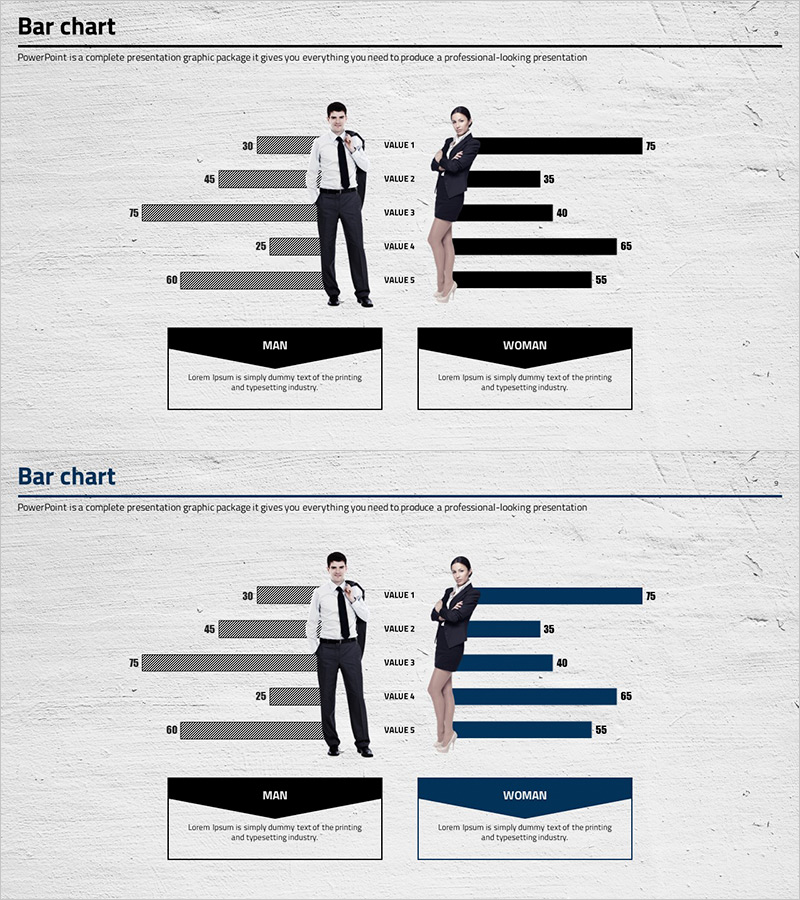
A professional horizontal bar chart PowerPoint slide designed for business performance and demographic analysis. This template features a symmetrical left-right comparison structure displaying five data points for male and female categories, making it ideal for customer segmentation, team performance metrics, and gender-based analytics. The two-color scheme combines gray and black tones to emphasize professionalism, while integrated portrait photos and text areas enhance presentation credibility. The 2-slide set includes color variations (black and navy) for seamless brand customization and immediate editing.
Usage Points
-
Main Usage
Visualize comparative data across five metrics for two demographic groups using a symmetrical horizontal bar structure. The left-right layout enables intuitive comparison of differences, while integrated portrait photos provide clear gender distinction. Ideal for analysis sections in business reports, proposals, and marketing presentations where data credibility is essential.
-
How to Use
Replace bar values with your own data and update the legend labels (MAN·WOMAN) and descriptive text. Select the color variant slide (black or navy) that matches your corporate brand guidelines, then insert into your presentation. Applicable to customer demographics, employee satisfaction surveys, sales performance comparisons, and market research findings.
-
Recommended For
Marketing teams analyzing customer demographics, HR departments presenting workforce statistics, sales teams comparing performance metrics, and executives preparing data-driven reports. Particularly suited for market research, customer satisfaction studies, and team performance evaluations requiring gender-based segmentation. Recommended for corporate reports, investor pitches, and business proposals across all departments.
-
Slide Structure
Slide 1: Black background with gray bars (left, 5 items) and black bars (right, 5 items), two portrait photos, MAN·WOMAN legend, and text description area. Slide 2: Identical layout with navy color scheme. Each bar displays numerical values (0–75 range), with five labeled items (VALUE 1–5) enabling clear data comparison.
Related Products
-

Competitor Comparison Paired Bar Graph – A Powerful Tool for Market Analysis
#Market and Competitor Analysis #Graph #Customer Analysis
-

Two-way Chart of Male and Female Surveys – Gender Comparison Visualization
#Market and Competitor Analysis #Graph #Customer Analysis
-

Gender Ratio Analysis Bar Graph – Customer Analysis and Competitive Advantage
#Market and Competitor Analysis #Graph #Customer Analysis
-

User Gender Ratio Analysis Graph – Effective Customer Insights
#Market and Competitor Analysis #Graph #Customer Analysis
