Market Trend Horizontal Bar Graph – The Perfect Choice for Market Analysis
RJ0600014_18
- Last Update 06/24/2025
- File Size 0.7MB
- # of Slides 2
- File Format PPTX
- Slide Ratio 16:9
- Color
Keywords
- #Content-Based Slides
- #Design-Based Slides
- #Market and Competitor Analysis
- #Graph
- #Market Status
- #Market Analysis
- #Horizontal Bar
- #Horizontal Bar Chart
- #16:9
- #horizontal bar chart PowerPoint
- #market trend presentation slide
- #competitive analysis chart
- #4-item comparison graph
- #bar graph template download
- #market analysis PowerPoint slide
About the Product
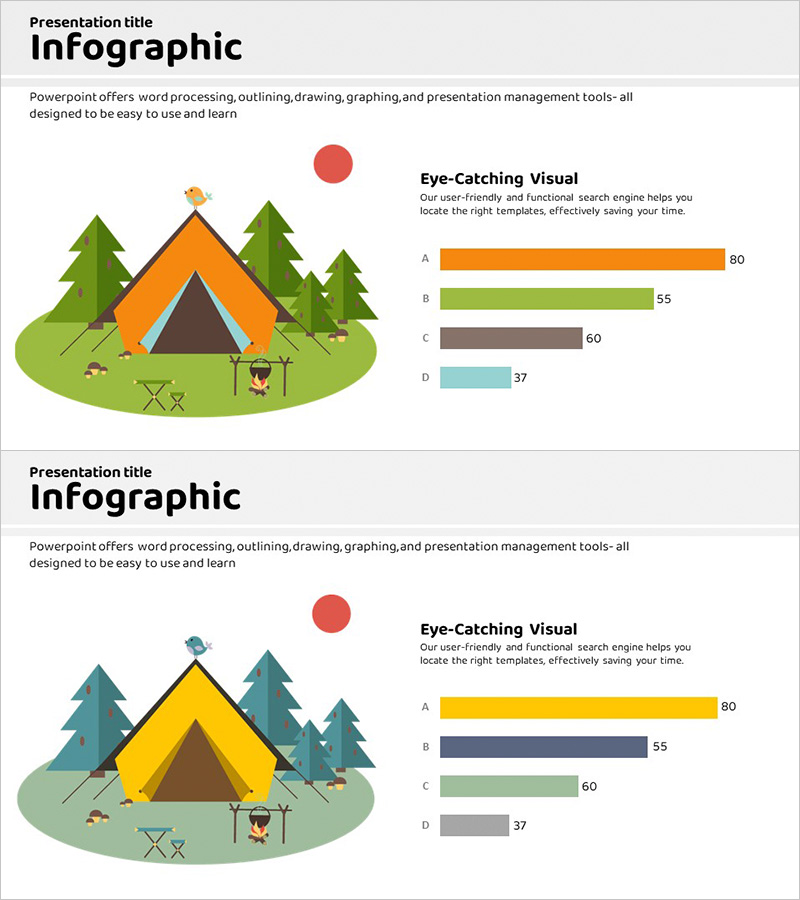
A horizontal bar chart PowerPoint slide optimized for market analysis and competitive benchmarking. This presentation slide features a camping-themed illustration paired with four data items (A–D) displayed as horizontal bars in orange, green, brown, and teal colors. The 2-slide PPTX template in 16:9 format is ready to use in market reports, business presentations, and marketing strategy decks. Each bar includes a numeric label for clear data interpretation, and the background illustration harmonizes with the chart layout to capture audience attention while conveying quantitative insights effectively.
Usage Points
-
Main Usage
Designed to compare four data items (market trends, competitive positions, sales performance) side-by-side using horizontal bars. The bar length enables instant visual comparison, while numeric labels provide precise values for data-driven discussions.
-
How to Use
Use in business reports, marketing strategy presentations, investor pitches, and market analysis briefings to explain competitive landscape, market share, or sales trends. The thematic illustration maintains audience engagement while supporting quantitative storytelling.
-
Recommended For
Marketing managers, business analysts, sales directors, and executives presenting market research findings. Ideal for situations requiring both qualitative context (lifestyle, travel, outdoor themes) and quantitative data representation.
-
Slide Structure
2-slide template with title area, camping-themed background illustration, 4 horizontal bars (A=80, B=55, C=60, D=37), and numeric labels per slide. 16:9 PPTX format compatible with all presentation platforms.
Related Products
-

Bar Chart for Class Evaluation Results – Visual Appeal and Eye-Catching
#Market and Competitor Analysis #Graph #Market Status
-

Green & Gray Template Wide Mockup – Market Analysis Use
#Market and Competitor Analysis #Other #Market Status
-

Triangular Prism Graph for Visualizing Market Status – Insights and Analysis
#Market and Competitor Analysis #Graph #Other
-

Competitor and Market Analysis Blue Navy PowerPoint Template
#Market and Competitor Analysis #Diagram #Graph
