Clock Image Shape Diagram – Product Status Presentation
RJ0300051_9
- Last Update 05/02/2025
- File Size 3.4MB
- # of Slides 2
- File Format PPTX
- Slide Ratio 16:9
- Color
Keywords
- #Content-Based Slides
- #Design-Based Slides
- #Product/Service Introduction
- #Diagram
- #Graph
- #Composition
- #Development Status
- #Cluster
- #Circles
- #Chain Diagram
- #Pie Chart
- #16:9
- #clock pie chart PowerPoint
- #pie chart slide template
- #product status diagram
- #data ratio visualization
- #pie graph PowerPoint slide
About the Product
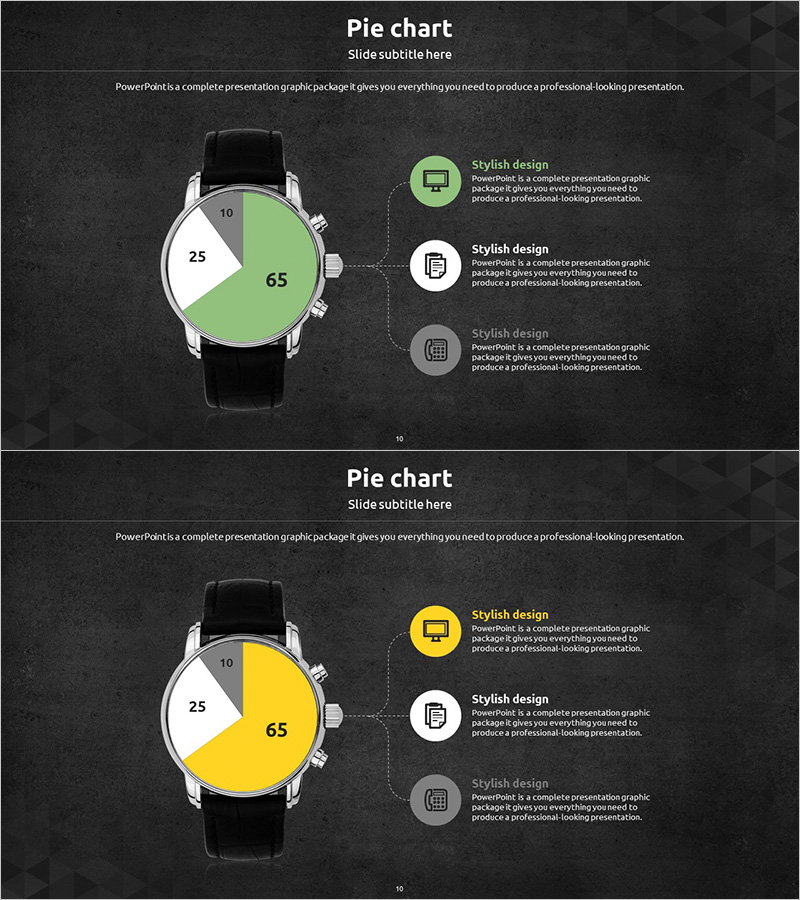
A 2-slide PowerPoint presentation featuring a clock-shaped pie chart for visualizing product status and data distribution. The design uses a dark background with contrasting green and yellow segments displaying three data points (65, 25, 10) with numerical labels. The right side includes three circular icons with accompanying text descriptions to enhance information delivery. This slide template is ideal for product presentations, market share analysis, sales reports, and status updates in business decks. All elements are fully editable and ready to customize with your own data and labels.
Usage Points
-
Main Usage
Visualize product status, market share, or sales distribution across three categories using an eye-catching clock-shaped pie chart. The dark background and color contrast create a professional presentation suitable for executive briefings and business reports.
-
How to Use
Insert this slide into product overview presentations, quarterly business reports, or marketing analysis decks. Edit the numerical values, segment labels, and icon descriptions to match your actual data. The clock design serves as a memorable visual anchor for your key metrics.
-
Recommended For
Product managers, marketing professionals, sales teams, business analysts, and executives presenting data-driven insights. Ideal for investment pitches, board meetings, and client presentations where visual impact and data clarity are essential.
-
Slide Structure
Two-slide layout with clock-shaped pie chart (3 segments: 65%, 25%, 10%), left-side chart area, and right-side information panel containing three circular icons with text descriptions. Optimized for 16:9 widescreen format in fully editable PPTX.
Related Products
-

Revenue Model and Cost Analysis Circle Graph
#Product/Service Introduction #Business Introduction #Diagram
-

Building Structure Composition Contents Slide – Product and Service Introduction
#Product/Service Introduction #Diagram #Product/Service Introduction
-

Development Status Pie Chart – Efficient Data Delivery
#Product/Service Introduction #Market and Competitor Analysis #Graph
-

Business Details Diagram - Perfect Blend of Functionality and Design
#Product/Service Introduction #Diagram #Product/Service Introduction
