Gender Ratio Bar Graph – Market and Competitor Analysis
RJ0300050_17
- Last Update 05/01/2025
- File Size 1MB
- # of Slides 2
- File Format PPTX
- Slide Ratio 16:9
- Color
Keywords
- #Content-Based Slides
- #Design-Based Slides
- #Market and Competitor Analysis
- #Graph
- #Competitor Analysis
- #Competitive Advantage
- #Horizontal Bar
- #Double Horizontal Bar
- #16:9
- #horizontal bar chart PowerPoint
- #gender ratio comparison slide
- #market analysis template
- #competitor analysis chart
- #data visualization presentation
About the Product
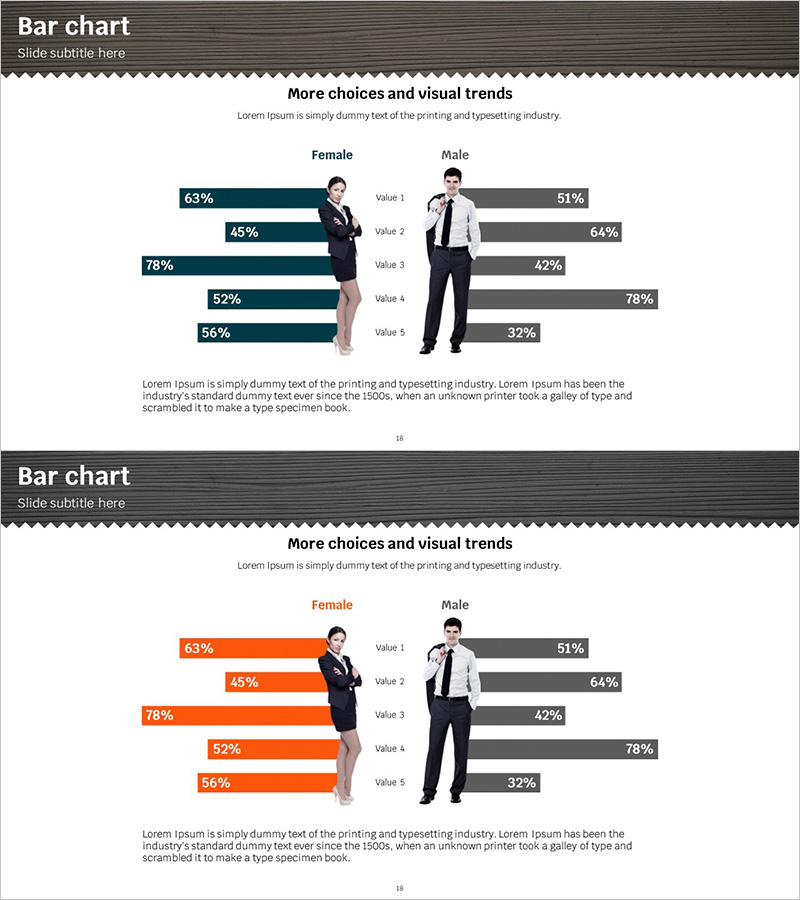
A horizontal bar chart PowerPoint slide for comparing gender ratios across five data points. Female data is displayed in teal bars on the left, while male data appears in orange bars on the right, creating a symmetrical comparison layout. Perfect for market analysis, competitor benchmarking, customer preference surveys, and demographic studies. The slide deck includes actual business person images to enhance credibility and professionalism. Formatted in 16:9 widescreen with 2 slides, all colors and percentages are fully editable to match your presentation needs.
Usage Points
-
Main Usage
Visualizes gender-based differences in preferences, purchase rates, satisfaction levels, and other metrics using symmetrical left-right bar comparison. Ideal for market segmentation, customer demographic analysis, competitive positioning, and data-driven business decision-making presentations.
-
How to Use
Replace the five data values (Value 1 through Value 5) with your own statistics. Input female data into the left teal bars and male data into the right orange bars. Modify percentage numbers and labels as needed. Color schemes can be easily adjusted to match your corporate branding or presentation theme.
-
Recommended For
Marketing professionals, market research analysts, sales strategists, business executives, academic presenters, and data analysts who need to compare gender-based metrics. Suitable for consumer behavior analysis, product preference studies, advertising effectiveness measurement, and demographic reporting across industries.
-
Slide Structure
Two-slide set featuring identical layouts with different color schemes. First slide uses teal and orange bars; second slide uses orange and gray bars. Each slide includes a 5-item horizontal bar comparison chart with business person imagery (female and male), title section, and descriptive text area for context or insights.
Related Products
-

Competitor Analysis and Competitive Advantage Visualization – Harmony of Green and Orange
#Market and Competitor Analysis #Diagram #Graph
-

Comparative Analysis of Sales of Camping Competitors – Insights and Comparisons
#Market and Competitor Analysis #Graph #Competitor Analysis
-

Competitive Advantage 3D Bi-directional Bar Graph – Essential Tool for Market Analysis
#Market and Competitor Analysis #Graph #Competitor Analysis
-

Cloud System Comparison Analysis Graph – Visualizing Competitive Advantage
#Market and Competitor Analysis #Graph #Competitor Analysis
