Marketing Strategy Diagram & Graph – Optimized for Market and Competitive Analysis
RJ0300041_12
- Last Update 04/28/2025
- File Size 2.2MB
- # of Slides 2
- File Format PPTX
- Slide Ratio 16:9
- Color
Keywords
- #Content-Based Slides
- #Design-Based Slides
- #Market and Competitor Analysis
- #Marketing Plan and Strategy
- #Diagram
- #Graph
- #Market Analysis
- #Marketing Strategy
- #Flow
- #Cluster
- #Column
- #Chain Diagram
- #Column Chart
- #16:9
- #circular diagram PowerPoint
- #bar chart slide template
- #marketing strategy diagram
- #market analysis graph
- #competitive analysis PPT slide
About the Product
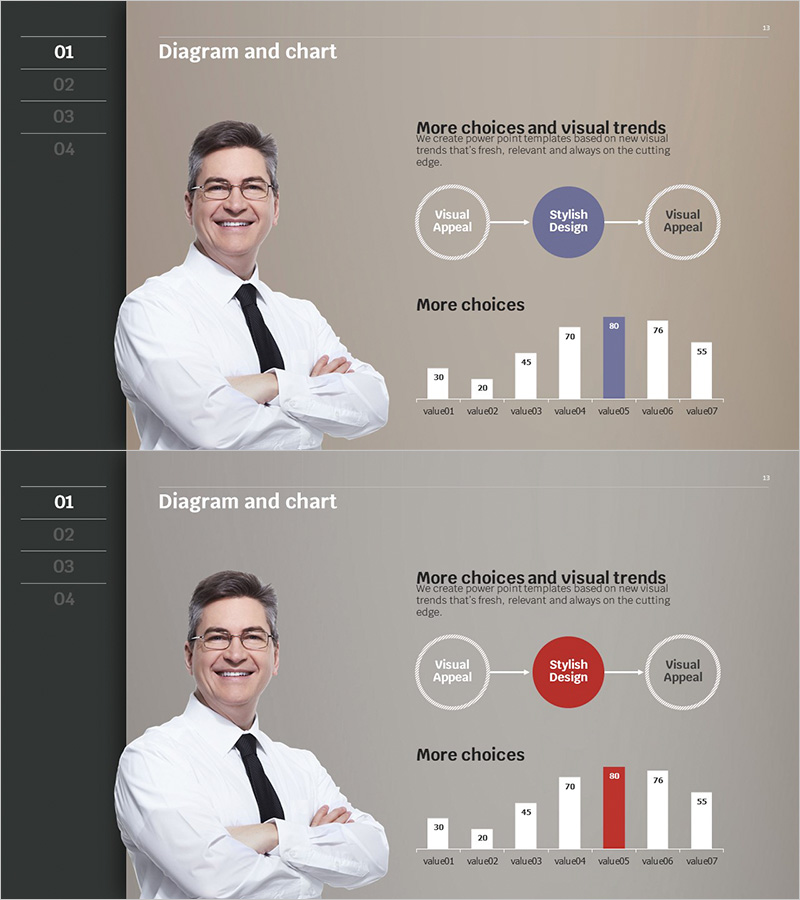
A 2-slide PowerPoint set optimized for marketing strategy development and market analysis presentations. The first slide features a 3-node circular diagram (Visual Appeal → Stylish Design → Visual Appeal) that illustrates the interconnection of key marketing strategy elements. The second slide displays a 7-item vertical bar chart (value01 through value07) for comparing and visualizing market data and competitive analysis metrics. The beige-toned background combined with white, blue, and red accent colors ensures both professionalism and visual clarity. Fully editable in PowerPoint, these slides are ready for use in presentations, planning documents, and business reports.
Usage Points
-
Main Usage
Visualize the interconnection of key marketing strategy elements using a circular diagram, and compare market data and competitive metrics using a bar chart. Supports strategic planning by presenting decision-making evidence visually and improving communication with executives and team members.
-
How to Use
Replace the 3-node text on the first slide with your core marketing strategy elements (e.g., target audience, messaging, channels). Update the 7-bar data on the second slide with actual market figures and competitive benchmarks. Adjust accent colors (blue or red) based on emphasis priorities.
-
Recommended For
Ideal for marketing managers, planners, and executives presenting strategy meetings, reports, and proposals. Particularly effective for market entry strategies, new product launches, and competitive benchmarking scenarios requiring data-driven decision-making.
-
Slide Structure
Slide 1: 3-node circular diagram with a central node (Stylish Design, blue) connected via bidirectional arrows to two outer nodes (Visual Appeal, white). Slide 2: Vertical bar chart with 7 items (value01–value07), with select bars highlighted in blue or red to facilitate comparative analysis.
Related Products
-

Corporate Strategy Diagram Leading the Future – Visualizing Business Flow
#Business Vision and Strategy #Marketing Plan and Strategy #Diagram
-

Gradient Overlay Circular Diagram – Visualizing Business Strategy
#Business Vision and Strategy #Marketing Plan and Strategy #Diagram
-

Entertainment Business Analysis Graph - Market Analysis and Marketing Strategy
#Market and Competitor Analysis #Marketing Plan and Strategy #Diagram
-

Arrow Map to Illustrate Distribution Strategy - Market Analysis
#Market and Competitor Analysis #Marketing Plan and Strategy #Diagram
