Blue Green Development Status Circular Graph – Market Analysis Through Data Visualization
RJ0300046_9
- Last Update 05/01/2025
- File Size 3.4MB
- # of Slides 2
- File Format PPTX
- Slide Ratio 16:9
- Color
Keywords
- #Content-Based Slides
- #Design-Based Slides
- #Product/Service Introduction
- #Market and Competitor Analysis
- #Graph
- #Development Status
- #Market Share
- #Circles
- #Doughnut Chart
- #16:9
- #doughnut chart PowerPoint
- #circular graph slide template
- #ratio comparison chart
- #data visualization PowerPoint
- #donut chart download
About the Product
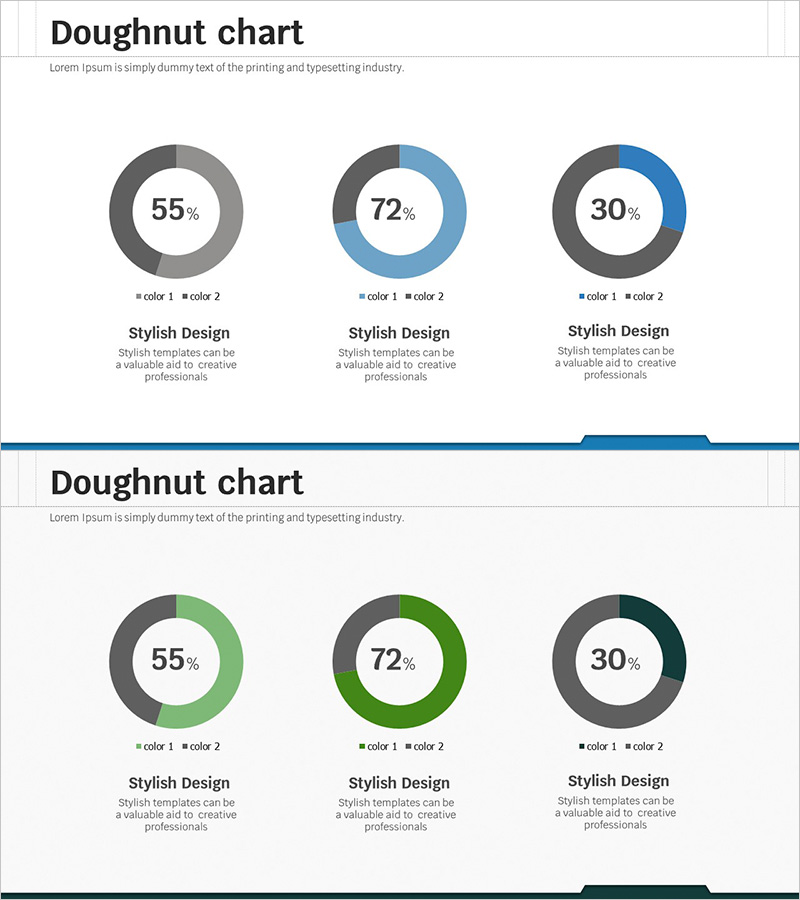
Visualize development status, market analysis, and product metrics using doughnut-shaped circular charts in this PowerPoint slide template. The two-color segmentation in blue, green, and gray tones clearly represents the ratio of three data points, with centered percentage displays enhancing data readability. This 16:9 widescreen 2-slide deck is ready to use in presentations, reports, proposals, and business documents.
Usage Points
-
Main Usage
Visualize key metrics such as development progress, market analysis, and product overview using doughnut-shaped circular charts. The centered percentage display emphasizes critical figures, while the two-color segmentation intuitively conveys ratio differences between data points.
-
How to Use
Insert into presentation slides, business reports, proposals, and marketing plans within market analysis, performance analysis, or customer analysis sections. Edit the slide data and legends to input actual figures, and customize colors to match your organization's brand guidelines.
-
Recommended For
Ideal for executives, marketing teams, sales teams, planning departments, and analytics teams presenting data-driven reports and strategic planning. Suitable for expressing ratio data such as development progress rates, market share, customer satisfaction, and product composition percentages.
-
Slide Structure
2-slide layout featuring three doughnut charts per slide (displaying 55%, 72%, and 30% data) arranged horizontally. Each chart includes a legend and descriptive text area below. Two-color segmentation in blue, green, and gray tones differentiates data series.
Related Products
-

Business Idea Development Status Graph – Ideas and Growth
#Product/Service Introduction #Market and Competitor Analysis #Graph
-

Analysis graph of market share progress
#Product/Service Introduction #Market and Competitor Analysis #Graph
-

Analysis of Work Progress – Utilizing Pie Chart
#Product/Service Introduction #Market and Competitor Analysis #Graph
-

City Theme Market Share Graph – Business Data Visualization
#Product/Service Introduction #Market and Competitor Analysis #Graph
