SNS Business Analysis Circular Graph
RJ0300046_27
- Last Update 04/30/2025
- File Size 3.4MB
- # of Slides 2
- File Format PPTX
- Slide Ratio 16:9
- Color
Keywords
- #Content-Based Slides
- #Design-Based Slides
- #Business Introduction
- #Market and Competitor Analysis
- #Graph
- #Technological Status
- #Market Analysis
- #Circles
- #Pie Chart
- #16:9
- #pie chart PowerPoint slide
- #3-segment pie chart template
- #SNS business analysis presentation
- #data ratio visualization
- #market share pie chart
- #business analysis PPT download
About the Product
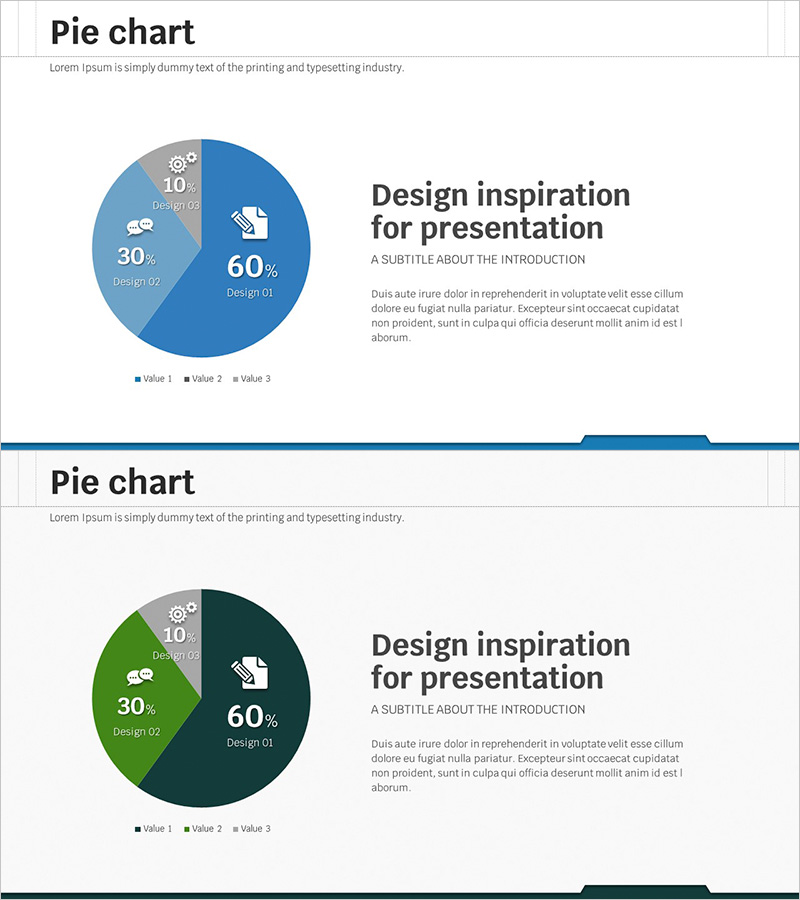
A 2-slide PowerPoint set featuring 3-segment pie charts designed for SNS business analysis and market data visualization. Available in blue and green color versions, each slide displays proportional data (60%, 30%, 10%) with integrated icons and labels. Optimized for presenting user distribution, channel performance, and market share metrics. Delivered in 16:9 widescreen PPTX format, fully editable and ready for immediate use in presentations and reports.
Usage Points
-
Main Usage
Visualize three-part proportional data such as SNS platform user distribution, marketing channel performance ratios, and market share analysis. The clear segmentation and percentage labels enable audiences to quickly grasp comparative relationships between data categories.
-
How to Use
Insert into business analysis presentations, marketing strategy reports, and quarterly performance reviews where data proportions need emphasis. Double-click each segment to edit colors, labels, and percentages to match your actual data. Resize and reposition text boxes as needed.
-
Recommended For
Marketing managers, business analysts, executives preparing performance reports, and SNS platform teams presenting data-driven insights. Ideal for startup pitch decks, quarterly business reviews, investor presentations, and strategic planning meetings.
-
Slide Structure
Slide 1 (Blue tone): 3-segment pie chart with 60% primary segment, 30% secondary segment, 10% tertiary segment; each includes icon and label. Slide 2 (Green tone): identical structure in alternate color scheme. Title and description text area positioned on the right side of each slide.
Related Products
-

Green Yellow Data Analysis Chart – Market and Competitive Analysis
#Business Introduction #Market and Competitor Analysis #Diagram
-

Budget Allocation by Strategic Focus
#Business Introduction #Market and Competitor Analysis #Graph
-

Detailed Regional Analysis Chart – Market Share Visualization
#Market and Competitor Analysis #Graph #Market Share
-

Circular Graph for Big Data Analysis – Data Visualization
#Business Introduction #Technical Approach #Graph
