Budget Allocation by Strategic Focus
RJ0300044_25
- Last Update 04/30/2025
- File Size 0.2MB
- # of Slides 2
- File Format PPTX
- Slide Ratio 16:9
- Color
Keywords
- #Content-Based Slides
- #Design-Based Slides
- #Business Introduction
- #Market and Competitor Analysis
- #Graph
- #Technological Status
- #Market Analysis
- #Circles
- #Pie Chart
- #16:9
- #pie chart PowerPoint slide
- #circular graph template
- #resource allocation chart
- #3-segment pie diagram
- #budget distribution visualization
- #ratio chart PowerPoint download
About the Product
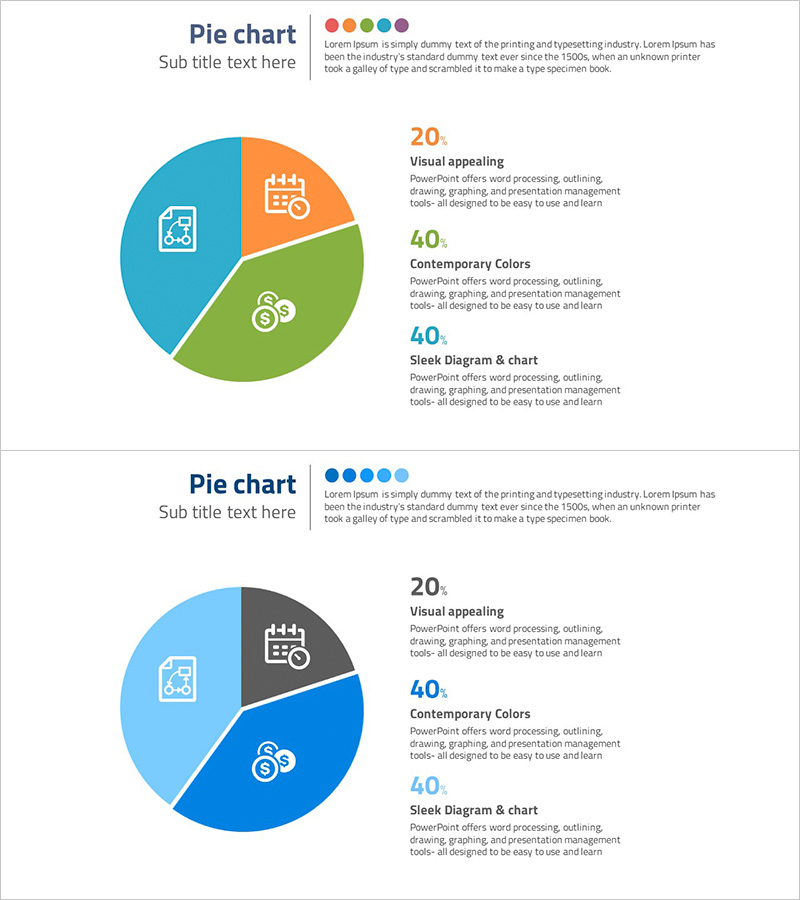
A pie chart PowerPoint slide that divides budget allocation by strategic focus into three segments using teal, orange, and green colors. Each section displays percentage values with corresponding icons and descriptive text on the right, enabling clear communication of resource distribution across investment categories. The 2-slide template accommodates various data scenarios and is ready for immediate use in business planning, marketing strategy, and budget presentations. Icons enhance categorical meaning while maintaining visual clarity and professional appearance.
Usage Points
-
Main Usage
Optimized for expressing strategic resource distribution such as investment capital, marketing budget, and workforce allocation as proportional segments. Combines percentage values with descriptive text to clearly convey decision-making rationale, delivering high-credibility data visualization for presentations to executives, investors, and team members.
-
How to Use
Two slides provided: first features the 3-color pie chart, second offers a blue-tone monochrome version. Edit each segment's percentage values and labels with your data, then input category names and descriptions in the right-side text area. Icons can be customized to match your categories.
-
Recommended For
Ideal for CFOs, finance managers, strategic planning teams, and marketing leaders explaining budget allocation, investment portfolios, and market share distribution. Also suitable for executive reports visualizing organizational resource deployment, project prioritization, and customer segment revenue composition.
-
Slide Structure
Slide 1: Pie chart with three segments—teal (left), orange (top-right), green (bottom-right)—each with embedded icon, right-side text area displaying three lines of percentage and description. Slide 2: Identical structure rendered in blue, gray, and light-blue monochrome tones for print and grayscale compatibility.
Related Products
-

SNS Business Analysis Circular Graph
#Business Introduction #Market and Competitor Analysis #Graph
-

Green Yellow Data Analysis Chart – Market and Competitive Analysis
#Business Introduction #Market and Competitor Analysis #Diagram
-

Visualizing Current Internet Shopping Payment Technologies with Horizontal Bar Graph
#Business Introduction #Market and Competitor Analysis #Graph
-

Online Shopping Mall Composition Analysis Graph - Business Analysis and Technical Insights
#Business Introduction #Market and Competitor Analysis #Graph
