Development Status Analysis Radial Graph – A Tool for Competitive Edge and Growth
RJ0300044_14
- Last Update 04/29/2025
- File Size 0.2MB
- # of Slides 2
- File Format PPTX
- Slide Ratio 16:9
- Color
Keywords
- #Content-Based Slides
- #Design-Based Slides
- #Product/Service Introduction
- #Market and Competitor Analysis
- #Graph
- #Development Status
- #Competitive Advantage
- #Other
- #Radar Chart Spider Chart
- #16:9
- #radial chart PowerPoint
- #5-axis radar diagram slide
- #competitive analysis template
- #polygon data visualization
- #how to create radial chart in PowerPoint
About the Product
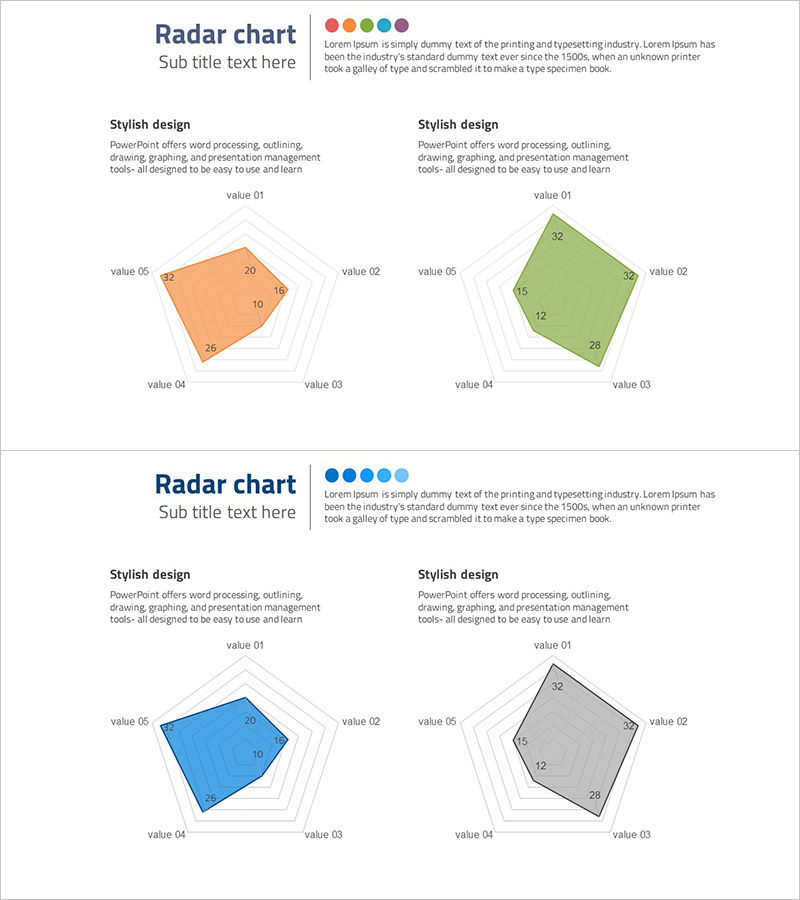
A 2-slide PowerPoint radial chart template featuring 5-axis radar diagrams in orange and green color schemes. Each slide displays a filled polygon shape that visualizes multiple data points simultaneously, making it ideal for competitive benchmarking, capability assessment, and performance analysis. The orange version and green version enable side-by-side comparison of current state versus target metrics or competitor positioning. Fully editable axes and data labels allow instant customization for market analysis, product evaluation, and strategic planning presentations.
Usage Points
-
Main Usage
Visualize and compare five dimensions of data simultaneously using filled polygon shapes. Ideal for competitive benchmarking, product capability matrices, team skill assessments, market positioning analysis, and multi-factor performance evaluation in a single view.
-
How to Use
Input numerical values into each axis label (value 01 through value 05) and the polygon shape automatically adjusts to reflect the data. Use the orange version for current state and green version for target or competitor data. Arrange both versions side-by-side on the same slide for direct comparative analysis.
-
Recommended For
Strategy planners, marketing managers, product managers, and business analysts preparing competitive analysis reports. Suitable for business plan presentations, quarterly performance reviews, product positioning pitches, team capability assessments, and executive strategy briefings.
-
Slide Structure
2-slide set with one 5-axis radial polygon per slide. Orange-filled polygon on slide 1, green-filled polygon on slide 2. Numerical data labels positioned at polygon vertices and center. Concentric gridlines provide reference scale for data comparison.
Related Products
-

Development Status Radial Graph – Clarifying Business Vision and Goals
#Product/Service Introduction #Business Vision and Strategy #Diagram
-

Doughnut Chart for Logistics Performance – Analysis by Transport Method
#Product/Service Introduction #Market and Competitor Analysis #Diagram
-

3-Axis Radar Chart Analysis – Effective Data Visualization
#Product/Service Introduction #Marketing Plan and Strategy #Diagram
-

Online Presentation Template - Pie Chart & Radar Chart
#Product/Service Introduction #Market and Competitor Analysis #Graph
