Competitor Comparison Analysis Broken Line Overlay Graph
RJ0300044_12
- Last Update 04/29/2025
- File Size 0.3MB
- # of Slides 2
- File Format PPTX
- Slide Ratio 16:9
- Color
Keywords
About the Product
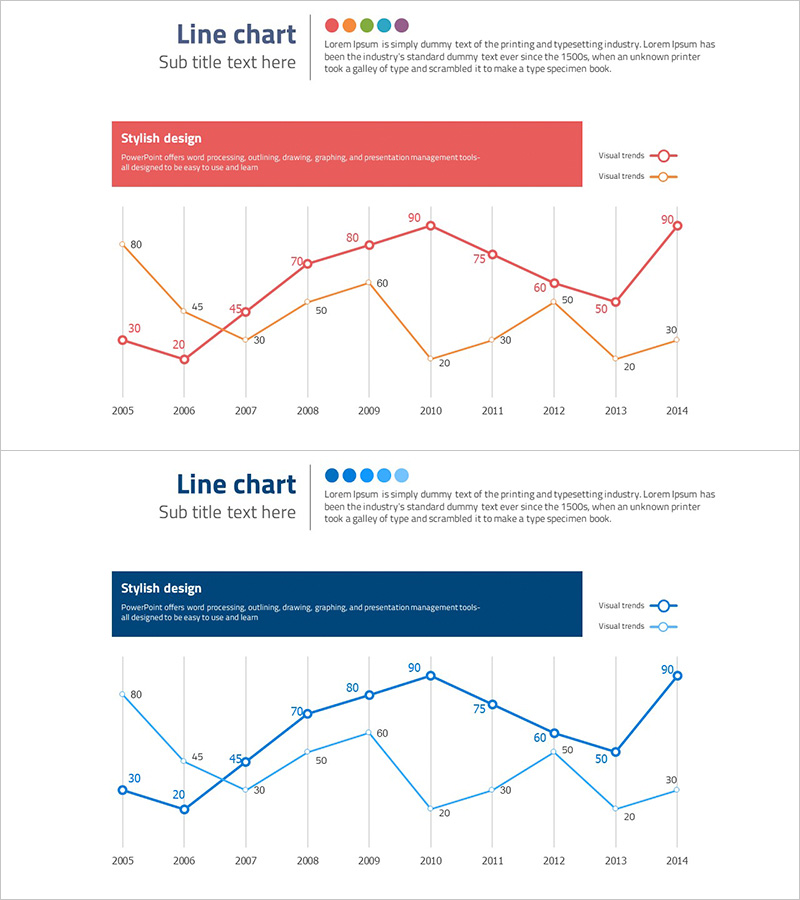
A dual-series line chart PowerPoint slide designed for competitor comparison and market trend analysis. This presentation template visualizes 10-year performance data (2005–2014) using red and orange lines to distinguish between two metrics, with data point values clearly labeled for precise comparison. The 16:9 widescreen format includes 2 slides that are ready to use and fully editable at the cell level, allowing you to input your own data seamlessly. Ideal for strategic presentations, investor pitches, and market analysis reports.
Usage Points
-
Main Usage
Display comparative performance metrics between competitors or track two key indicators over time, such as market share, revenue, customer satisfaction, or sales volume. The overlapping lines make it easy to identify crossover points and performance gaps, supporting strategic decision-making and stakeholder communication.
-
How to Use
Replace the sample data points and values with your actual metrics. Update the title and subtitle to reflect your analysis topic and time period. Customize the legend labels to match your two data series. Adjust line colors and styles to align with your corporate branding guidelines.
-
Recommended For
Marketing managers, sales directors, and strategy consultants presenting competitive analysis to executives, investors, or clients. Also suitable for management consulting firms, market research agencies, financial analysts, and business intelligence teams preparing comparative performance reports.
-
Slide Structure
Two-slide set featuring a title area, legend showing two data series, gridded coordinate axes, dual line plots with 10 data points each, and numeric labels at each point. The red and orange lines intersect and diverge throughout the timeline, creating a dynamic visual comparison optimized for analytical presentations.
Related Products
-

Competitor Capability Analysis Chart – Efficient Market Analysis
#Market and Competitor Analysis #Graph #Competitor Analysis
-

Project Market Environment Analysis Chart – Powerful Competitive Strategy
#Market and Competitor Analysis #Graph #Competitor Analysis
-

Medical Experimental Research Data Analysis Slide – Market and Competitor Analysis
#Market and Competitor Analysis #Graph #Competitor Analysis
-

Black Navy Broken Line Graph Table – Market and Competitor Analysis
#Market and Competitor Analysis #Diagram #Graph
