Idea Conference Connection Diagram – Visualization of Business Strategy
RJ0300045_17
- Last Update 04/30/2025
- File Size 0.4MB
- # of Slides 2
- File Format PPTX
- Slide Ratio 16:9
- Color
Keywords
- #Content-Based Slides
- #Design-Based Slides
- #Business Strategy
- #Business Management
- #Diagram
- #Step-by-Step Schedule Plan
- #Implementation Plan
- #Cluster
- #Chain Diagram
- #16:9
- #connection diagram PowerPoint
- #4-step process slide
- #business strategy presentation
- #cluster diagram
- #idea conference slide template
About the Product
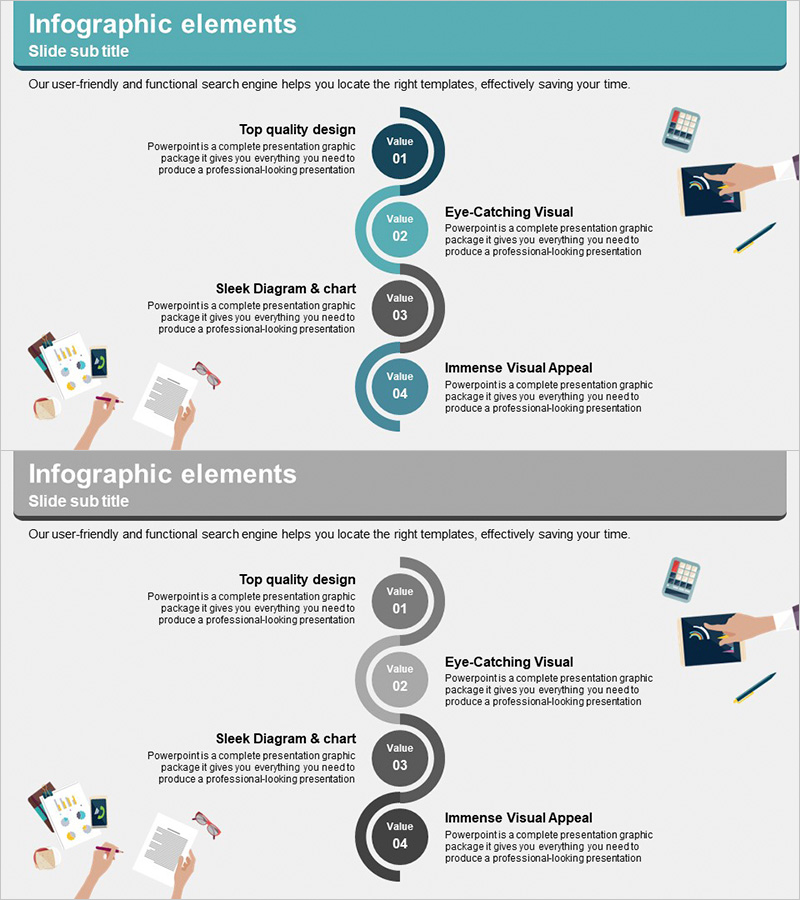
A 4-node connection diagram PowerPoint slide designed to visualize idea conference workflows and business strategy execution. Circular nodes in teal and gray tones are connected by curved arrows, clearly expressing sequential processes and interdependencies. Left-side illustrations and right-side business icons reinforce the meaning of each stage, while ample text areas allow detailed strategy content input. Two color scheme options (teal-gray combination) enable customization to match corporate branding, and the 16:9 widescreen format optimizes for modern presentation environments.
Usage Points
-
Main Usage
Visualizes a 4-stage business execution process and the interconnected relationships between stages. Structures concepts from idea conferences and clearly demonstrates process dependencies and feedback loops for strategic implementation.
-
How to Use
Use in executive reports, strategy presentations, and business plan decks within the strategy development section. Input stage names, responsible parties, and timelines in each node's text area. Customize node colors to distinguish priorities or categories as needed.
-
Recommended For
Ideal for executives, strategy managers, project managers, and marketing planners presenting business strategy development to teams. Particularly suited for multi-stage decision-making processes, cross-departmental collaboration workflows, and new business initiative roadmaps.
-
Slide Structure
Four circular nodes (Value 01–04) connected by curved arrows. Each node contains title and description text areas. Left side features business-related illustrations (meeting, documents, hand, pen), while right side displays business icons (tablet, passport, pen) to enhance visual context.
Related Products
-

Step-by-Step Schedule Diagram – Business Strategy and Management
#Business Strategy #Business Management #Diagram
-

Sailing Travel Business Work Process Connection Diagram
#Business Strategy #Business Management #Diagram
-

Schedule Planning Speech Bubble Diagram – Business Strategy and Connection Design
#Business Strategy #Business Management #Diagram
-

3STEP Diagram – Effective Visualization of Business Strategy
#Business Strategy #Business Management #Diagram
