System Architecture for Efficient Communication
RB0200021_5
- Last Update 03/09/2025
- File Size 3.5MB
- # of Slides 2
- File Format PPTX
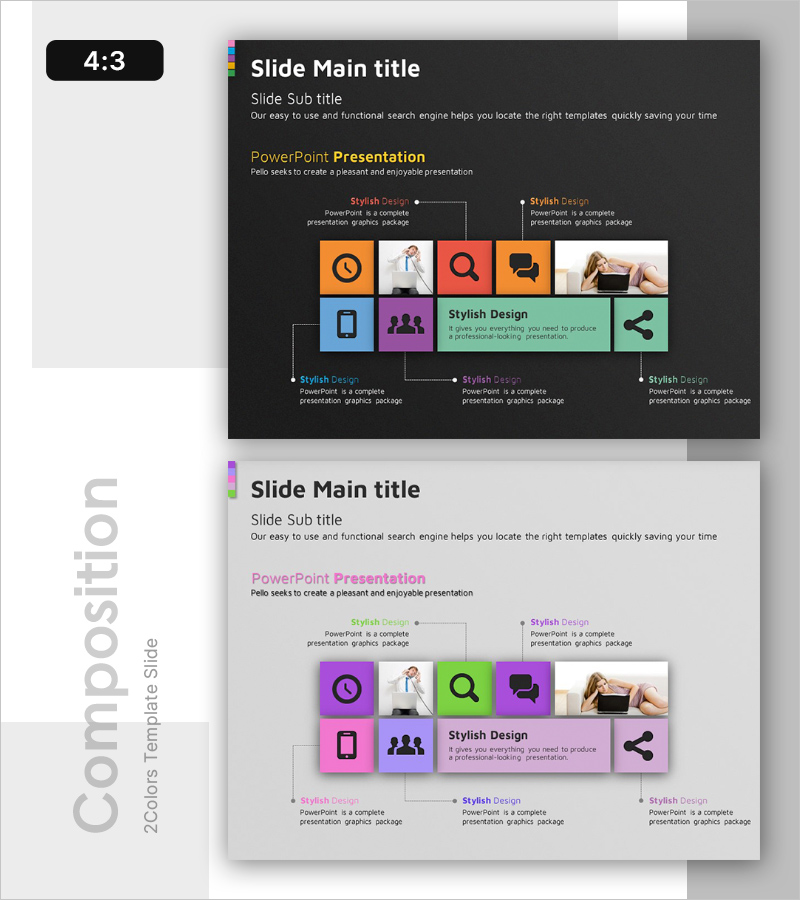
- Slide Ratio 4:3
- Color
Keywords
About the Product
A closed cluster diagram PowerPoint slide designed to visualize system architecture and organizational structures. The slide features six color-coded nodes (orange, blue, purple, and green) arranged around a central green hub on a dark background. Each node includes an icon and descriptive text, with connecting arrows and dotted lines clearly showing relationships between components. The 2-slide deck (4:3 aspect ratio) is fully editable and ready for immediate use in corporate presentations, technical explanations, and organizational overviews.
Usage Points
-
Main Usage
Ideal for expressing system architecture, organizational hierarchies, departmental relationships, process flows, and network configurations with a central hub model. Effectively communicates technical systems, organizational structures, and system overviews in professional presentations.
-
How to Use
The dark background provides high contrast for clear visibility in projector environments. Customize each node's icon and text to match your content, and adjust colors and arrows to emphasize key relationships and hierarchies.
-
Recommended For
Recommended for IT departments explaining system architecture, executives presenting organizational structures, marketing teams showing channel relationships, consulting firms detailing process flows, and educational institutions illustrating learning structures.
-
Slide Structure
Two-slide deck with the first slide featuring a dark background with six color-coded nodes and a central green hub connected by dotted arrows in a closed cluster formation. The second slide presents the same structure on a light background, suitable for printing and document distribution.
Related Products
-

Supplement and Diet Product Introduction Slide - Linear Flow Diagram
#Product/Service Introduction #Diagram #Features
-

Hexagonal Text Box with Icons – Visual Explanation Focus
#Product/Service Introduction #Diagram #Text Box
-

A Representative Plant of Autumn - Cluster Diagram Slide
#Product/Service Introduction #Diagram #Features
-

Pegboard Illustration Diagram – Product Characteristics and Composition Introduction
#Product/Service Introduction #Diagram #Features
