Business Goals Diagram – Conceptualizing Business Strategy
RJ0300038_9
- Last Update 04/28/2025
- File Size 0.1MB
- # of Slides 2
- File Format PPTX
- Slide Ratio 16:9
- Color
Keywords
- #Content-Based Slides
- #Design-Based Slides
- #Business Vision and Strategy
- #Marketing Plan and Strategy
- #Diagram
- #Business Goals
- #Marketing Objectives
- #Flow
- #Linear Flow
- #16:9
- #linear diagram PowerPoint
- #3-step flowchart slide
- #business goals presentation
- #strategy process diagram
- #workflow PowerPoint template
About the Product
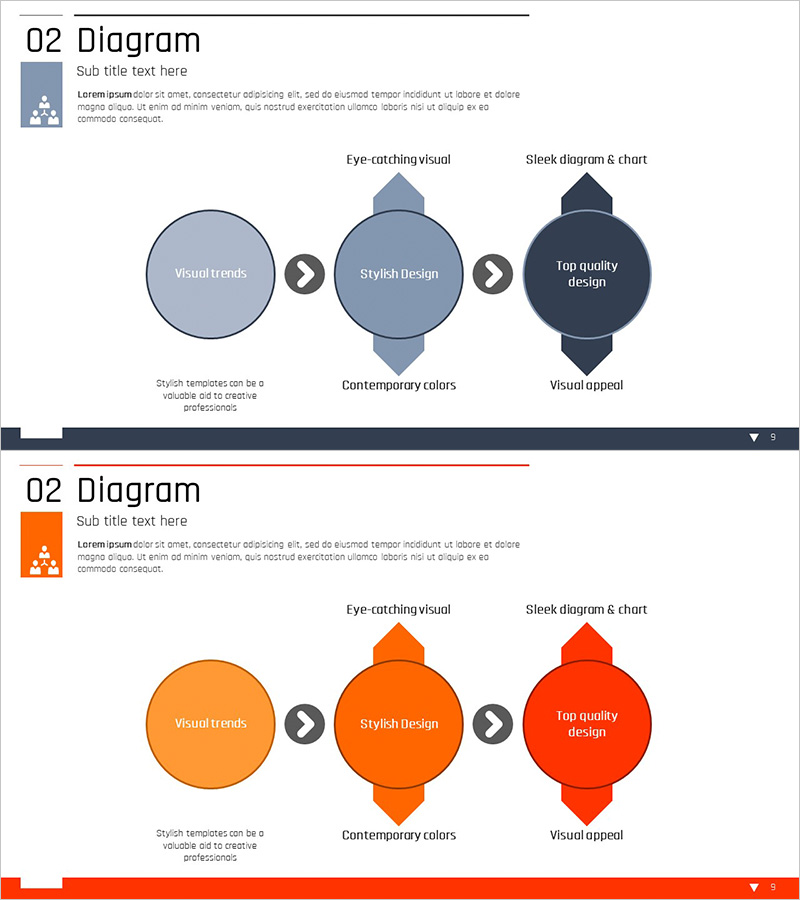
A three-stage linear diagram PowerPoint slide that visualizes the business goal-setting and strategy development process. Featuring light blue, medium blue, and dark blue circular nodes connected by directional arrows, this slide template clearly illustrates the progression from visual trends through stylish design to top-quality outcomes. The 2-slide deck in 16:9 format is ready to use for marketing planning, strategic roadmap presentations, and project milestone communications. Fully editable nodes allow you to input your organization's specific goals and phases, making it ideal for executive briefings, team workshops, and client presentations.
Usage Points
-
Main Usage
Clearly visualize business goal-setting phases, strategic planning processes, marketing roadmaps, and project execution stages using a three-step linear flow. This diagram enhances audience comprehension and effectively communicates strategic direction and organizational priorities.
-
How to Use
Enter stage-specific goals in each circular node (e.g., Market Analysis → Strategy Development → Implementation Plan). Add detailed descriptions in the text areas below each node. Customize node colors to match your corporate brand identity. Use in executive presentations, team meetings, and client pitches to explain strategic progression and milestone achievements.
-
Recommended For
Strategy planners, marketing managers, business development professionals, management consultants, and project managers who need to present goal-achievement pathways, organizational strategy, or phased project timelines. Also suitable for onboarding sessions and internal training on company strategic direction.
-
Slide Structure
Slide 1: Three circular nodes (light blue → medium blue → dark blue) connected by directional arrows on a blue background, with descriptive text areas below each node. Slide 2: Identical diagram structure in orange and red color variations for design flexibility. 16:9 aspect ratio, fully editable PPTX format.
Related Products
-

Marketing Goals Process – Establishing Business Vision and Strategy
#Business Vision and Strategy #Marketing Plan and Strategy #Diagram
-

Marketing Process Goals Diagram – Effective Strategy Development
#Business Vision and Strategy #Marketing Plan and Strategy #Diagram
-

Marketing Achievement Goals for Brand Growth – Vision and Strategy
#Business Vision and Strategy #Marketing Plan and Strategy #Diagram
-

Marketing Objectives Square Diagram - Clear and Intuitive Business Strategy
#Business Vision and Strategy #Marketing Plan and Strategy #Diagram
