Market Share Pie Chart – Data Visualization
RJ0300038_6
- Last Update 04/28/2025
- File Size 0.1MB
- # of Slides 2
- File Format PPTX
- Slide Ratio 16:9
- Color
Keywords
About the Product
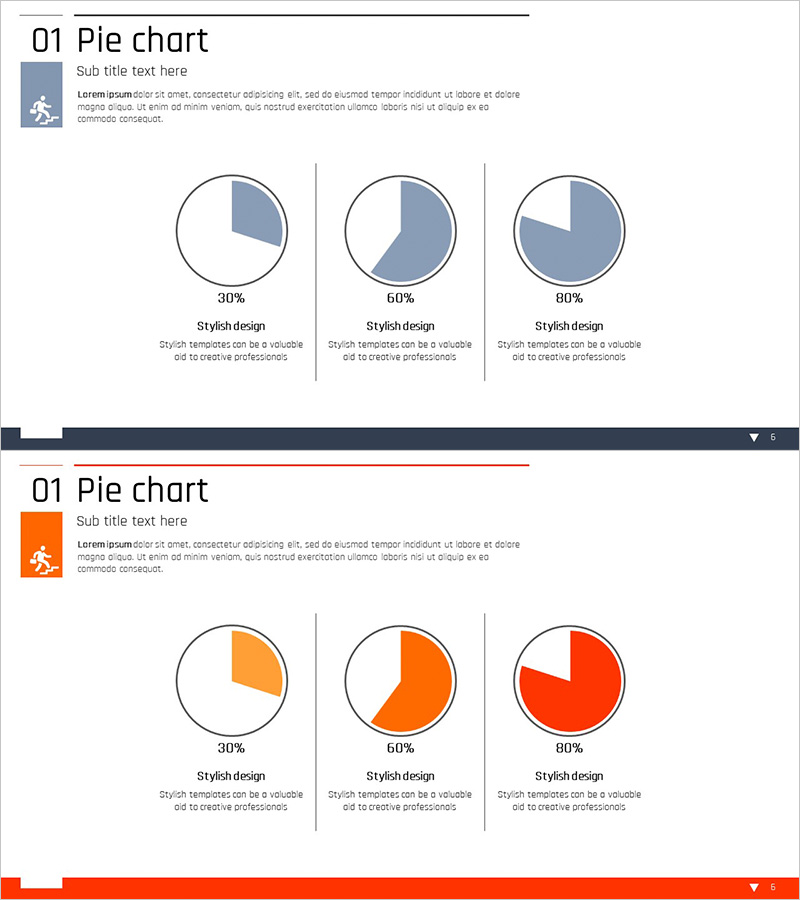
Visualize market share, sales ratios, and performance metrics with this free pie chart PowerPoint slide. Three color variations (blue, orange, red) let you match your corporate branding, and you can customize it instantly by editing text and numbers. The slide includes three example pie charts showing 30%, 60%, and 80% ratios, making it easy to represent diverse data. Edit effortlessly using PowerPoint's built-in tools. Perfect for business plans, investor pitch decks, marketing presentations, and executive reports.
Usage Points
-
Main Usage
Display market share, sales distribution, budget allocation, and performance metrics using pie charts to help audiences quickly understand proportional data.
-
How to Use
Replace the title and description text with your content, then update the chart percentages (30%, 60%, 80%) with your actual data. Select the color variation that matches your brand identity.
-
Recommended For
Ideal for business plans explaining market share, investor presentations comparing competitors, quarterly reports showing performance, and executive briefings on goal achievement rates.
-
Slide Structure
Single-slide design with title and description text areas, plus three pie charts arranged horizontally. Each chart is independently editable, and three color variations (blue, orange, red) are provided.
Related Products
-

Vertical Bar Chart for Data Analysis – Business Insights
#Free Graphs
-

Data Visualization with Bar Charts – Presentation for Efficient Choices
#Free Graphs
-

Vertical Bar Chart Visualizing Candidate Values – Trends and Choices
#Free Graphs
-

Competitive Advantage Bar General Graph – Emphasizing Performance through Market Analysis
#Free Graphs
