Competitor Comparison Broken Line Graph – Essential Tool for Market Analysis
RJ0300038_16
- Last Update 04/28/2025
- File Size 0.1MB
- # of Slides 2
- File Format PPTX
- Slide Ratio 16:9
- Color
Keywords
About the Product
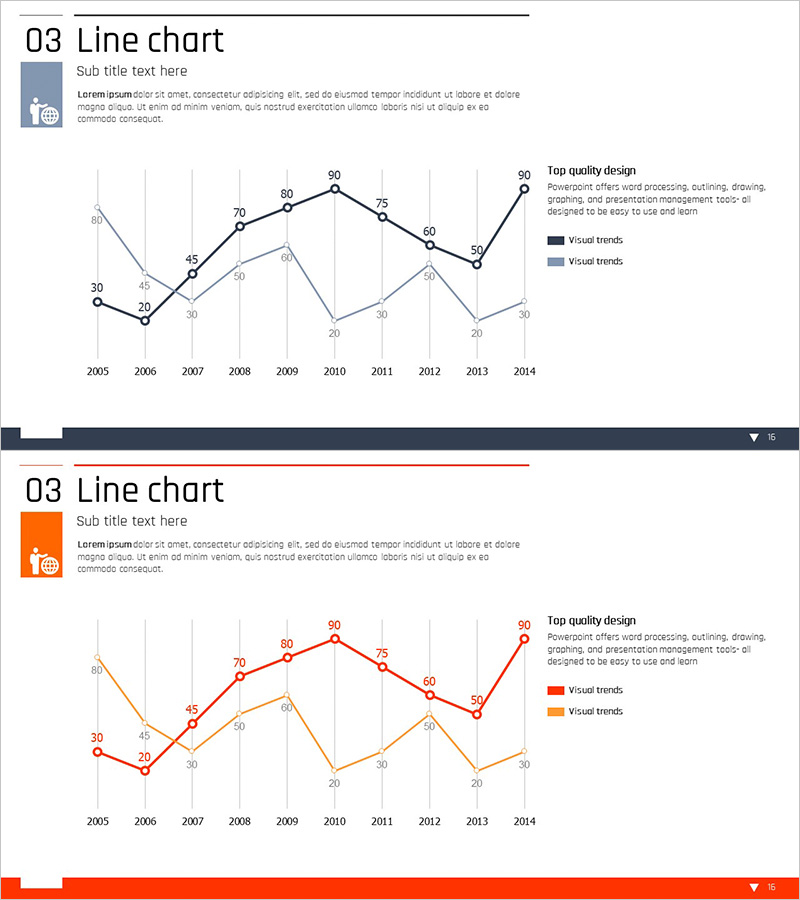
A dual-line chart PowerPoint slide comparing 10 years of market data (2005–2014) across two distinct series. Each slide features two trend lines in contrasting colors (dark blue and orange), with data point values clearly labeled for precise numerical comparison. Grid lines and legend are included, making this presentation slide ideal for competitive analysis, market trend analysis, and performance benchmarking in business reports and investor presentations.
Usage Points
-
Main Usage
Visualize competitor performance comparison, market trend analysis, and annual growth rate changes across multiple data series over time. The dual-line format enables side-by-side comparison of two metrics, making it essential for business presentations requiring relative performance analysis.
-
How to Use
Edit the data points and values on each slide with your actual market data. The color-coded lines (dark blue and orange) clearly distinguish the two series, while the legend and axis labels communicate data meaning. Use in quarterly reports, strategy meetings, investor pitches, and board presentations to highlight trend shifts.
-
Recommended For
Marketing managers, sales directors, financial analysts, and business executives presenting competitive analysis, quarterly performance reviews, market share trends, and departmental comparisons. Ideal for presentations comparing two products, regions, or business units simultaneously.
-
Slide Structure
2-slide set. Each slide displays two trend lines (dark blue and orange) with 10 data points spanning 2005–2014. Y-axis range 0–90 with grid lines, legend, and subtitle area for custom titles and descriptions.
Related Products
-

Competitor Capability Analysis Chart – Efficient Market Analysis
#Market and Competitor Analysis #Graph #Competitor Analysis
-

Space Illustration Theme Broken Line Graph
#Market and Competitor Analysis #Graph #Competitor Analysis
-

Black Navy Broken Line Graph Table – Market and Competitor Analysis
#Market and Competitor Analysis #Diagram #Graph
-

Competitor Technology Comparison Graph – Market and Competitor Analysis
#Market and Competitor Analysis #Graph #Competitor Analysis
