Bar Graph for Market and Competitor Analysis – Effective Data Visualization
RJ0300034_9
- Last Update 04/27/2025
- File Size 5.6MB
- # of Slides 2
- File Format PPTX
- Slide Ratio 16:9
- Color
Keywords
- #Content-Based Slides
- #Design-Based Slides
- #Market and Competitor Analysis
- #Graph
- #Competitor Analysis
- #Market Analysis
- #Horizontal Bar
- #Segmented Horizontal Bar
- #16:9
- #horizontal bar chart PowerPoint
- #stacked bar graph template
- #market analysis slide
- #competitor comparison chart
- #multi-series data visualization
- #how to create stacked bar chart in PowerPoint
About the Product
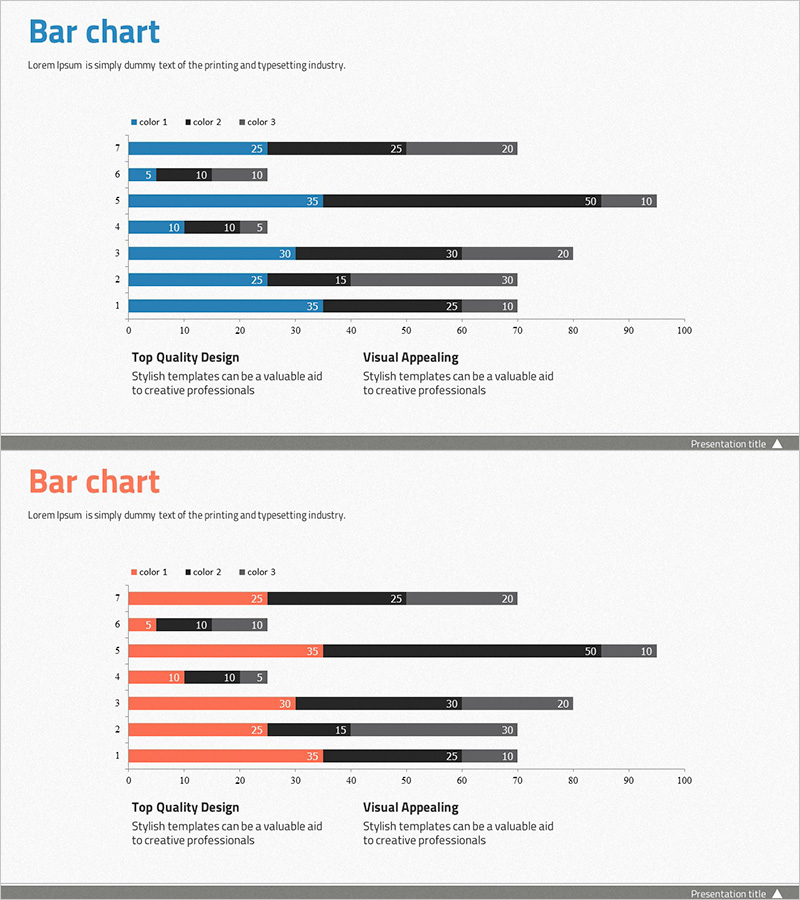
A horizontal stacked bar chart PowerPoint slide optimized for market analysis and competitor comparison. This data visualization template features three color series (blue, black, gray) enabling simultaneous comparison of up to 7 items across multiple categories. Each item displays three categorical values side-by-side, providing intuitive insight into competitive positioning. Ideal for presentations, reports, and business proposals where market share, sales volume, customer satisfaction, and other multi-dimensional metrics require clear visual representation.
Usage Points
-
Main Usage
Compare and analyze three or more data series simultaneously—such as market size, competitor market share, and sales performance. The stacked bar format allows stakeholders to instantly grasp relative magnitudes and competitive dynamics, supporting strategic planning and executive decision-making.
-
How to Use
Two-slide template: first slide emphasizes blue series, second emphasizes red series. Double-click each bar value to replace with actual data; the chart auto-scales within the 0–100 axis range. Fully editable legend, axis labels, and data point annotations.
-
Recommended For
Marketing teams presenting market analysis, sales teams benchmarking competitors, executive strategy briefings, consulting proposals with data sections, academic presentations requiring statistical comparison, and business intelligence dashboards.
-
Slide Structure
2-slide deck. Each slide contains a horizontal stacked bar chart with 7 rows (items) and 3 color-coded series (bars). Includes legend, axis labels, and numeric annotations. Optimized for 16:9 widescreen format with balanced white space.
Related Products
-

Financial Management Analysis Detailed Graph
#Market and Competitor Analysis #Graph #Competitor Analysis
-

VR Market Analysis Bar Graph – Understanding Competitive Landscape
#Market and Competitor Analysis #Graph #Competitor Analysis
-

Chemical Experiment Analysis Horizontal Bar Graph
#Market and Competitor Analysis #Graph #Competitor Analysis
-

Business Service Analysis Segmentation Graph – Ideal for Market and Competitor Analysis
#Market and Competitor Analysis #Graph #Competitor Analysis
