Graph of Development Status by Field – Visualizing Achievements
RJ0300034_6
- Last Update 04/27/2025
- File Size 5.6MB
- # of Slides 2
- File Format PPTX
- Slide Ratio 16:9
- Color
Keywords
- #Content-Based Slides
- #Design-Based Slides
- #Product/Service Introduction
- #Market and Competitor Analysis
- #Graph
- #Development Status
- #Market Share
- #Circles
- #Doughnut Chart
- #16:9
- #doughnut chart PowerPoint
- #donut graph template
- #ratio visualization slide
- #performance metrics PPT
- #circular chart download
About the Product
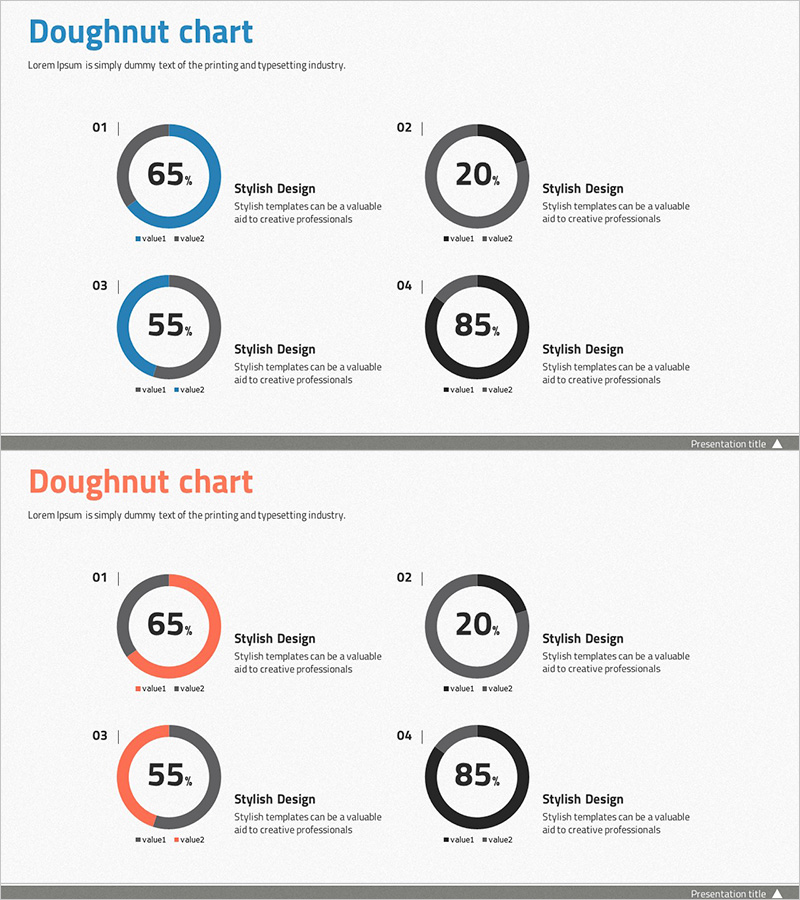
A 2-slide PowerPoint presentation featuring doughnut charts for visualizing performance metrics by category. Each slide displays four doughnut charts arranged in a 2×2 grid, enabling side-by-side comparison of multiple data sets. The first slide uses blue and gray color tones, while the second slide incorporates orange accent colors for visual variation. Each doughnut chart displays percentage values at the center with legends and descriptive text positioned to the right, facilitating clear data interpretation. Ready-to-use for business reports, performance presentations, and analytical documents.
Usage Points
-
Main Usage
Ideal for comparing ratios across multiple categories such as departmental performance, field development status, or component composition. The centered percentage values emphasize key metrics, while the 2×2 grid layout presents four items in balanced proportion.
-
How to Use
Perfect for executive presentations, quarterly performance reviews, and business status reports where you need to display achievement rates or composition percentages across multiple divisions. Simply edit the chart values and legends with your own data and insert directly into your presentation.
-
Recommended For
Recommended for executives, project managers, marketing professionals, and financial analysts who need to communicate quantitative results visually. Particularly effective for presentations comparing performance across multiple departments, regions, or product lines simultaneously.
-
Slide Structure
2-slide set with four doughnut charts per slide arranged in 2×2 grid. Percentage values centered in each chart, legends and descriptive text positioned right. First slide features blue and gray tones; second slide includes orange accent color variation for design flexibility.
Related Products
-

Financial Business Analysis Pie Chart – Market Share Insights
#Product/Service Introduction #Market and Competitor Analysis #Graph
-

Analysis graph of market share progress
#Product/Service Introduction #Market and Competitor Analysis #Graph
-

Analysis of Work Progress – Utilizing Pie Chart
#Product/Service Introduction #Market and Competitor Analysis #Graph
-

Development Status Analysis Donut Chart – Market Share Visualization
#Product/Service Introduction #Market and Competitor Analysis #Graph
